
Fig. 1.
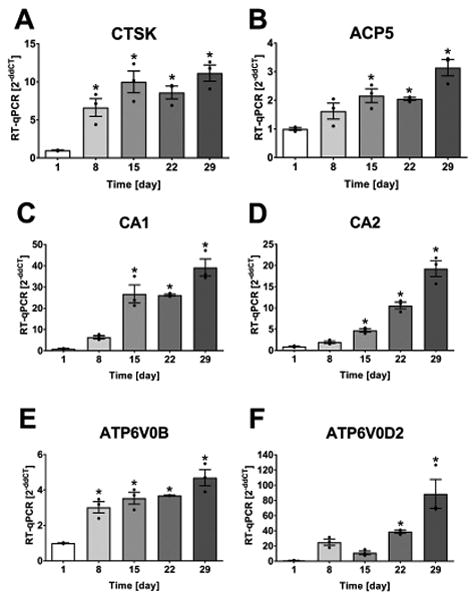
Increased expression of bone resorption related genes in osteocytes. IDG-SW3 cells were differentiated for 29 d. (A) CTSK (CT=23-21), (B) ACP5 (CT=29-28), (C) CA1 (CT=34-29), (D) CA2 (CT=32-29), (E) ATP6V0B (CT=24-23), and (F) ATP6V0D2 (CT=40-32) were significantly increased with osteocyte-differentiation. Graphs show individual data points, mean and SEM for fold change in gene expression compared to day 1 (4 experiments, representative experiment shown with n=3). Statistical analysis: one-way ANOVA and Dunnett posthoc test compared to day 1.