Fig. 5.

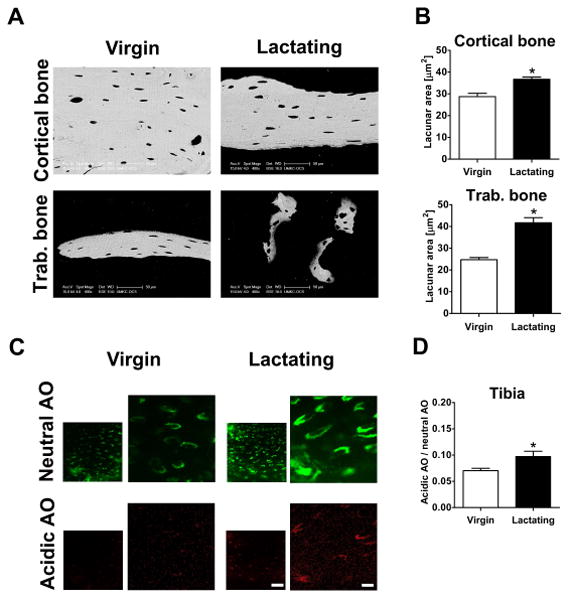
Lower pH in osteocyte lacunae of lactating mice. (A) Representative BSEM images of cortical (upper surface = periosteal, lower surface = endocortical) and trabecular bone from femora of virgin and lactating CD-1 mice. (B) Increased osteocyte lacunar area in cortical (100-300 lacunae) and trabecular (25-150 lacunae) bone in lactation group (mean and SEM, n=4 animals/group, unpaired two-tailed t-test compared to virgin). (C) Representative confocal images of acridine orange fluorescence in osteocyte lacunae in tibial cortex of virgin and lactating mice. In the left images the scale bar represents 50 μm, and in the right images, which are higher magnifications of the left the scale bar represents 10 μm. (D) Ratio of acidic to neutral AO fluorescence is significantly higher in lactating mice (mean and SEM, n=4 animals/group, 30-60 lacunae each, unpaired two-tailed t-test compared to virgin).
