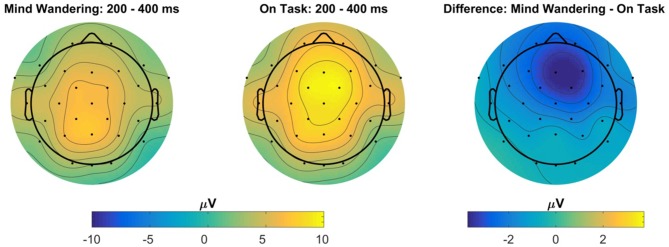
Figure 11.
Topography of the ERP to the auditory probe tone, for “mind wandering” vs. “on task” responses, averaged within the 200–400 ms P3a window following probe onset, collapsed across all days and drives. The right-most panel represents the topography of the difference between “mind wandering” and “on task” responses.

