Fig. 1.

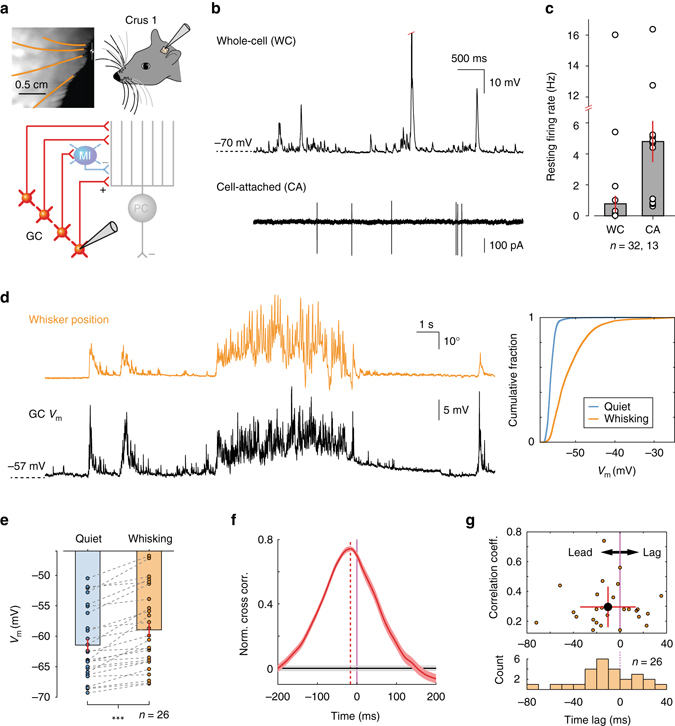
Whisking drives membrane potential depolarisation in cerebellar granule cells of awake mice. a Top left: videography of a head-restrained mouse with four traced whiskers (from row C, labelled in orange). Top right: schematic of experimental setup. Patch clamp recordings were made from lobule Crus 1 of the cerebellar cortex. Bottom: schematic representation of cerebellar circuit highlighting granule cells in the input layer. GC granule cell, MI molecular layer interneuron, PC Purkinje cell. b Top: whole-cell (WC) patch clamp recording from GC. Red tick indicates truncated action potential. Bottom: cell-attached (CA) recording from putative GC. c Resting GC firing rates in the absence of movement (n = 32 WC, n = 13 CA). A total of 26 out of 32 GCs were silent in WC configuration. d Left: example traces of whisker position (orange; upward deflection indicating protraction) and simultaneously recorded GC membrane potential V m (black). Right: cumulative probability of V m distribution during quiet and whisking epochs for this GC (P < 0.001, Kolmogorov–Smirnov test). e Mean V m in periods of quiet and whisking for all GCs that showed statistically significant differences in V m distribution between two conditions. V m is significantly depolarised during whisking (***P < 0.001, Wilcoxon signed-rank test, n = 26). f Normalised cross-correlation between whisker position and V m for a single GC. Purple line at zero depicts whisking onset. Vertical red dashed line highlights the peak in the cross correlogram, indicating temporal relationship between behaviour and GC V m. Horizontal grey lines: 95% confidence interval. GC exhibited depolarisation preceding the onset of whisking. g Top: scatter plot, indicating temporal relationship and strength of correlation between whisker position and GC V m. Black-filled circle: Mean ± S.D. Bottom: histogram of temporal relationship between behaviour and GC V m (n = 26)
