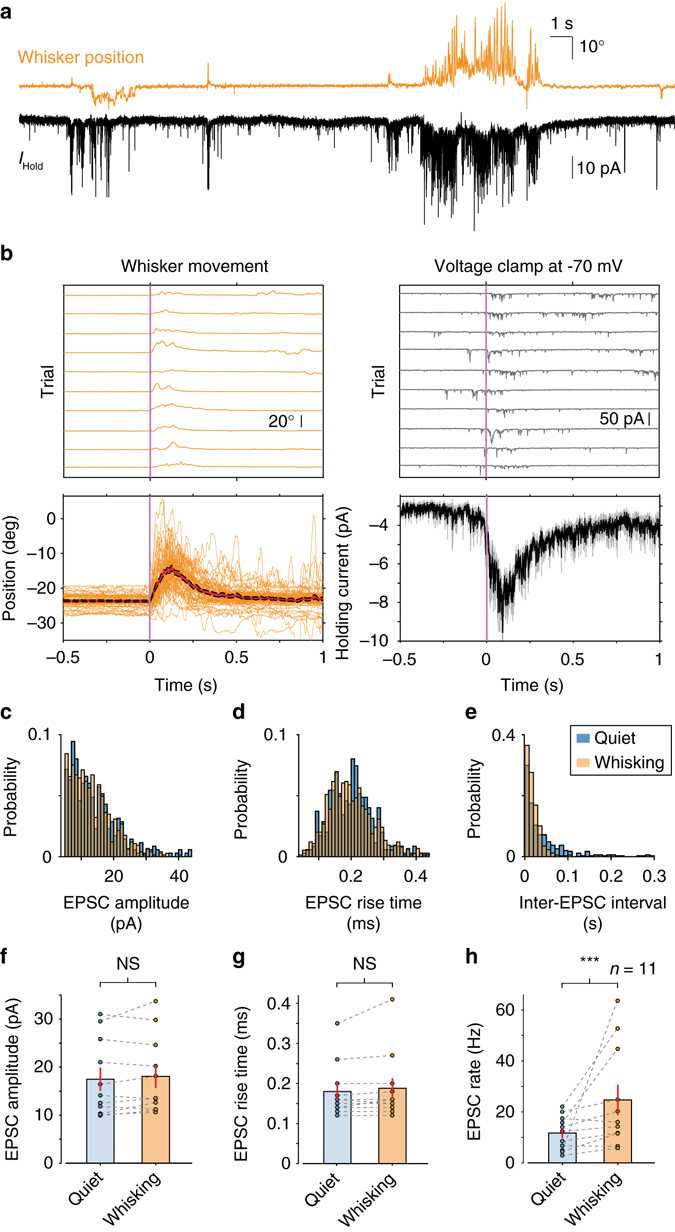
Fig. 2.

Elevated rates of mossy fibre synaptic input during whisking bouts. a Whisker position (orange; upward deflection indicating protraction) and simultaneously recorded holding current from GC-voltage clamped at −70 mV (black; downward deflections correspond to inward currents). b Top left: whisker position from 10 representative whisking epochs (trials). Top right: corresponding GC holding current. Voltage-clamp sweeps have been smoothed for visual clarity. Bottom left: raw position traces (orange) and mean whisker position (red line; black: S.E.M.) for all trials (n = 50 trials). Bottom right: mean holding current (black line; grey: S.E.M.) for all trials (n = 50 trials). c Normalised histogram of EPSC amplitude for a single GC during quiet and whisking epochs. No significant change was observed between the two conditions (P = 0.77, Kolmogorov–Smirnov test). d Normalised histogram of EPSC 20–80% rise-time for a single GC during quiet and whisking epochs. No significant change was observed between the two conditions (P = 0.07, Kolmogorov–Smirnov test). e Normalised histogram of EPSC inter-current interval for a single GC during quiet and whisking epochs. The two distributions were significantly different (P < 0.001, Kolmogorov–Smirnov test), with a larger proportion of short intervals during whisking. f Mean EPSC amplitude in periods of quiet and whisking for all GCs. No significant change was observed between the two conditions (P = 0.45, Wilcoxon signed-rank test, n = 11). g Mean EPSC 20–80% rise-time in periods of quiet and whisking for all GCs. No significant change was observed between the two conditions (P = 0.25, Wilcoxon signed-rank test, n = 11). h Mean EPSC rate in periods of quiet and whisking for all GCs. EPSC rate was significantly elevated during whisking epochs (***P < 0.001, Wilcoxon signed-rank test, n = 11)
