Fig. 5.

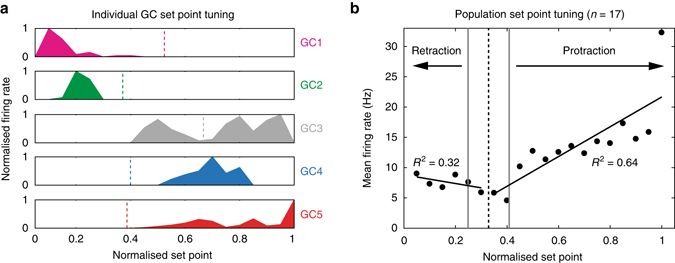
Set point tuning of cerebellar granule cells. a Five GC examples (GC1–GC5; WC data) demonstrating significant tuning of spike output to whisker set point (P < 0.05, Kolmogorov–Smirnov test). Firing rate was normalised with respect to the maximal rate in each tuning curve. Set point is normalised as percentile for comparison among cells. Individual GCs demonstrated sharp peaks at one or multiple set points. Vertical dashed lines indicate corresponding mean resting positions (when whiskers are not moving) for each GC. b Mean tuning curve for all GCs (n = 17) exhibiting significant rate modulation by set point. The data are represented in percentile across population of the whisker data with distinct ranges of set point variable. Black vertical dashed line indicates the mean resting position and grey dotted lines mark S.E.M. Linear regressions were performed over the range of retraction (R 2 = 0.32) and protraction (R 2 = 0.64), respectively
