Figure 3.

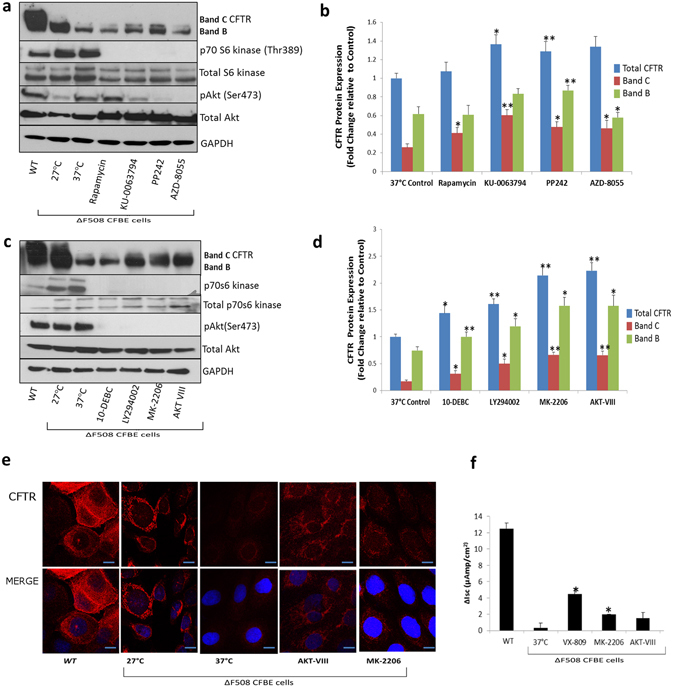
Targeting the PI3K/Akt/mTOR complex improves CFTR stability and function. (a) ΔF508 CFBE41o- cells (37 °C) were treated with Rapamycin, AZD-8055, PP-242, KU-0063794 (Set 1 inhibitors) and immunoblotting was performed for CFTR, pAkt Ser 473, p70 S6 kinase Thr389, Akt and p70 S6 kinase and GAPDH. WT HBE41o- cells and ΔF508 CFBE41o- cells incubated at 27 °C were included as positive controls and ΔF508 CFBE41o- cells incubated at 37 °C were included as a negative control. (b) A quantitative graph of CFTR (Total, Band B, Band C) from CFBE41o- cell lysates treated with Set 1 inhibitors. The results shown are representative of three independent experiments; the histograms represent the average and the error bars represent the standard deviation of the means. Statistical significance was examined using a two-tailed paired T-test analysis. Asterisk* represents p < 0.05, **represents p < 0.01. (c) ΔF508 CFBE41o cells (37 °C) were treated with LY-294002, 10-DEBC, MK-2206 and AKT-VIII and immunoblotting was performed for CFTR, pAKT Ser473, p70 S6 kinase Thr389, Akt and p70 S6 kinase and GAPDH. WT HBE41o- cells and ΔF508 CFBE41o- cells incubated at 27 °C were included as positive controls and ΔF508 CFBE41o- incubated at 37 °C were used as a negative control. (d) A quantitative graph of CFTR (Total, Band B, Band C) from ΔF508 CFBE41o lysates treated with Set 2 inhibitors. The results shown are representative of three independent experiments; the histograms represent the average and the error bars represent the standard deviation of the means. Statistical significance was examined using a two-tailed paired T-test analysis. Asterisk* represents p < 0.05, **represents p < 0.01. (e) Fluorescent detection was used to visualise CFTR (red- 549 nm) in ΔF508 CFBE41o- cells treated with MK-2206, AKT-VIII along with a negative control ΔF508 37 °C, positive controls ΔF508 27 °C and WT HBE41o- cells. Nuclei were stained with DAPI (blue- 358 nm). Scale bar is 10 µm. (f) Bar graph representing the change in Isc (ΔIsc) after forskolin (10 µM) and genistein (50 µM) addition relative to baseline readings in CFBE41o- cells treated with MK-2206, AKT-VIII, a negative control ΔF508 37 °C, positive controls VX-809 treatment and WT HBE41o- cells. Statistical significance was tested by a two-tailed paired T-test analysis. Asterisk* represents p < 0.05.
