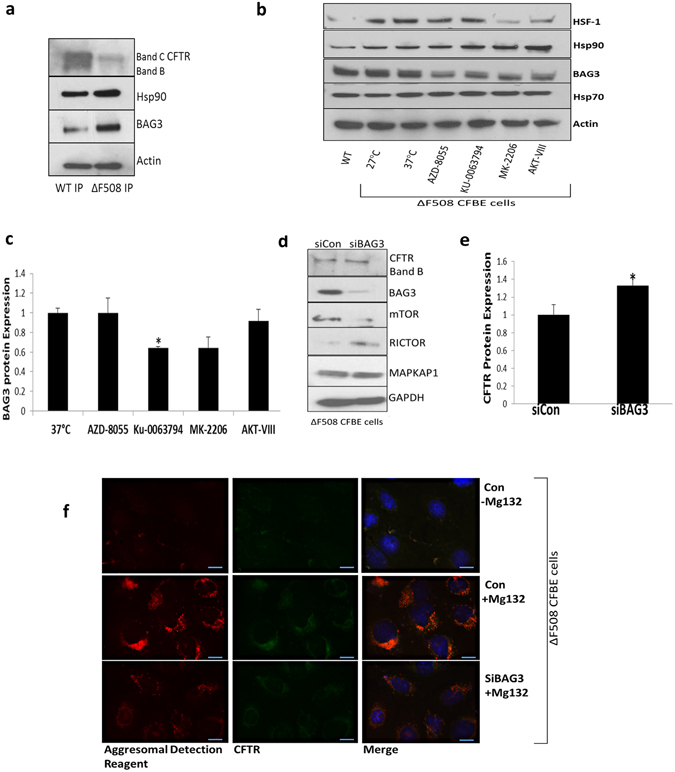
Figure 5.

PI3K/AKT/mTOR inhibition increases ΔF508 CFTR stability through BAG3. (a) CFTR was immunoprecipitated from WT HBE41o- and ΔF508 CFBE41o- cells and immunoblotting was performed for Hsp90, BAG3 and β-actin. (b) ΔF508 CFBE41o- cells (37 °C) were treated with AZD-8055, KU-0063794, AKT-VIII and MK-2206 and the protein expression of Hsp70, Hsp90, BAG3 and HSF1 and actin was determined. WT HBE41o- cells and ΔF508 CFBE41o- cells (27 °C) acted as positive controls and ΔF508 CFBE41o- (37 °C) was a benchmark for comparison (c) A quantitative graph of BAG3 from ΔF508 CFBE41o- lysates, CFBE41o- cells (37 °C) were treated with AZD-8055, KU-0063794, AKT-VIII and MK-2206. The results shown are representative of three independent experiments; the histograms represent the average and the error bars represent the standard deviation of the means. Statistical significance was examined using a two tailed by paired T-test analysis. Asterisk *represents p ≤ 0.05 (d) Protein expression levels of CFTR, mTOR, RICTOR, MAPKAP1 and BAG3 were determined by immunoblotting in ΔF508 CFBE41o- cell lysates treated with control and BAG3 siRNA. (e) A quantitative graph of CFTR from ΔF508 CFBE41o- cell lysates treated with control (siCon) and BAG3 siRNA (siBAG3) was performed. Statistical significance was examined using a two-tailed paired T-test analysis. Asterisk* represents p < 0.05. (f) Fluorescent detection was used to visualise CFTR (green- 488 nm) and aggresomes (red- 549 nm) in ΔF508 CFBE41o- cells treated and untreated with proteasome inhibitor MG132 (10 µM) to validate the presence of aggresomes in these cells after MG132 treatment. Aggresome fromation in ΔF508 CFBE cells in the presence of siBAG3 relative to siControl under proteasomal inhibiton was then investigated. Nuclei were stained with DAPI (blue- 358 nm).
