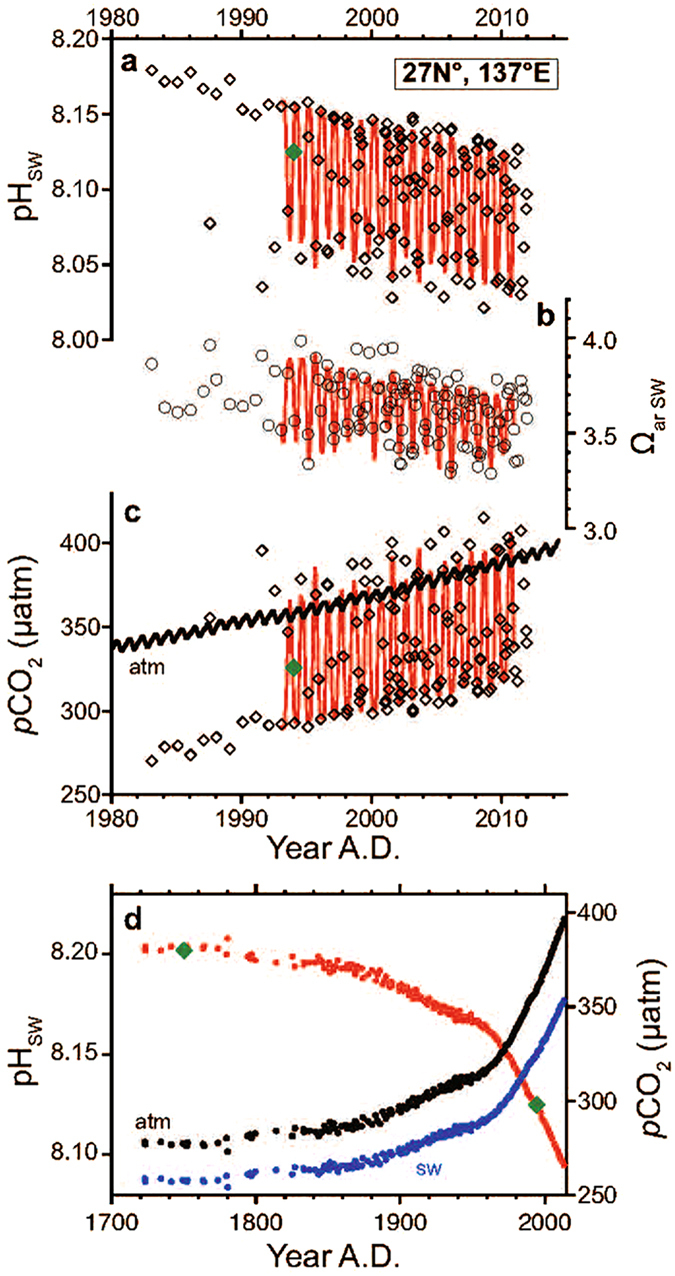
Figure 2.

pHSW and pCO2 variability. (a–c) Time series (lines) and discrete data (open symbols) for pHSW, ΩarSW, and pCO2 in the western North Pacific near Chichijima and Kikaijima since 1980 at monthly resolution. Monthly atmospheric pCO2 records measured at the MLO17 are also shown in (c). (d) Variability in pHSW (red) and pCO2 (blue, seawater; black, atmosphere) since the preindustrial era. Atmospheric pCO2 in 1959–2013 was measured at the MLO17 and atmospheric pCO2 before 1959 was reconstructed from trapped air in the Antarctic ice sheet18. pHSW calculated from Global Data Analysis Project DIC and TA for the years 1994 and 1750 (ref. 3) are indicated by the green diamonds in (a and d).
