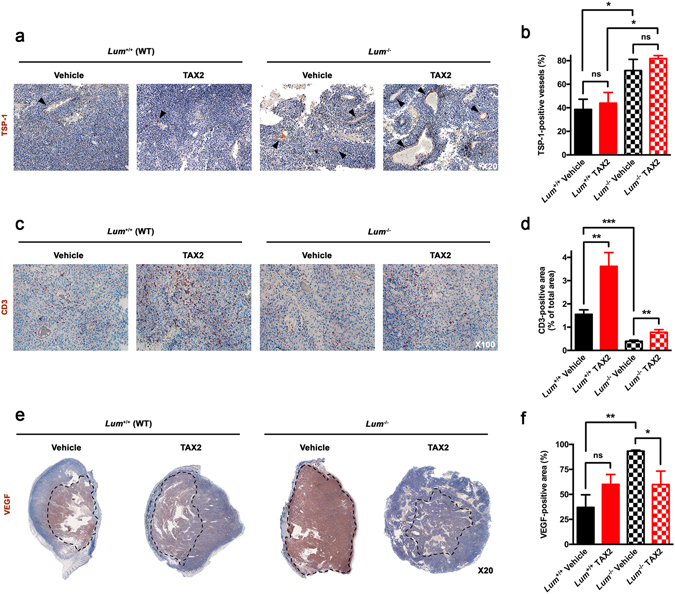
Figure 3.

IHC analyses of s.c. melanoma allografts stromal features. (a–f) Microscopic views of tissue sections IHC allowing visualization of intratumoral (a) TSP-1 (×20, black arrowheads), (c) CD3 (×100) and (e) VEGF (×20, dotted lines) immunostainings and quantification of (b) percentage of TSP-1-positive blood vessels as well as relative (d) CD3-positive and (f) VEGF-positive areas (mean ± SEM, t test, ns not significant, *p < 0.05, **p < 0.01, ***p < 0.001). All quantitative analyses were performed using ImageJ software. Five random fields were considered for TSP-1 and CD3 immunostainings, while the whole tumor section was analyzed for VEGF positivity.
