Figure 5.

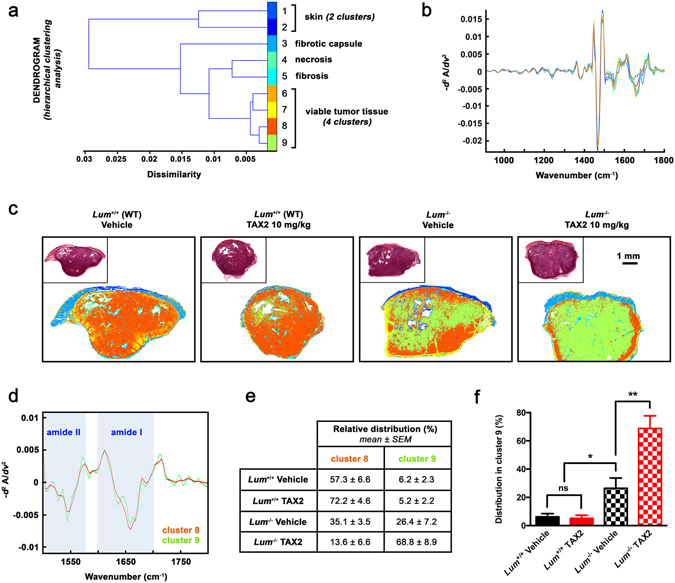
K-means clustering of tumor FT-IR spectral images. (a) Dendrogram obtained as a result of hierarchical clustering showing spectral dissimilarity between the 9 cluster centroids estimated by unsupervised K-means clustering of s.c. tumor infrared images. Random pseudo-colors were attributed to each cluster, while comparison to adjacent HES-stained sections allowed histological annotations of K-means subclasses. (b) Second derivative spectra (900–1800 cm−1) of corresponding cluster centroids. (c) Representative color-coded K-means clustered images of tumor sections. All eliminated spectra by extended multiplicative signal correction algorithm (i.e. pure paraffin and low signal-to-noise ratio spectra) were colored as white pixels. Insets show adjacent HES-stained tissue sections. (d) Second derivative spectra (1500–1800 cm−1) of centroids of clusters 8 (orange) and 9 (green). Most discriminant amide II and amide I bands are shown as blue bars. (e) Mean relative distribution of pixels attributed to clusters 8 and 9 among tumors from animal subgroups, expressed as a percentage of total pixels. (f) Histogram shows results from statistical analysis of relative distribution within cluster 9 (mean ± SEM, t test, ns not significant, *p < 0.05, **p < 0.01).
