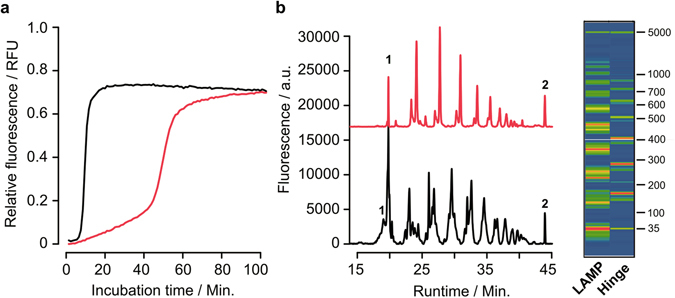
Figure 2.

Comparison of the LAMP- and hinge-amplification reaction for the detection of PSTVd. Real-time amplification curves of the LAMP assay (black) and the Hinge-assay (red) at 65 °C for 100 minutes. Fluorescence values are normalized (a). Capillary electrophoresis of LAMP (black) and Hinge samples (red) is shown as electropherogram with fluorescence values vs. runtime. Peaks 1 and 2 represent the internal size-standard (35 bp and 5000 bp). The virtual gel image on the right depicts the amplified DNA products of both samples (b). The size marker ranges from 35 bp to 5000 bp. Both reactions contained 0.2 ng of total input PSTVd DNA.
