
Figure 4.
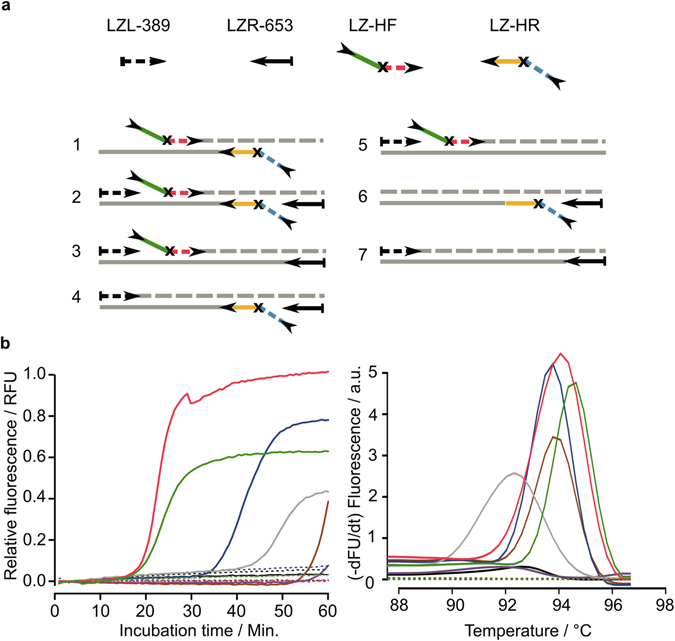
Analysis of the reaction kinetics with respect to different hinge-primer combinations using dSpacer as blocking-site. (a) Overview of primer combinations for symmetric reaction (1–2) and asymmetric reaction (3–7) (b) Normalised real-time amplification curves for each combination. (c) Melting-curve analysis. Red: combination 1, green: combination 2, blue: combination 4, grey: combination 3, brown: combination 6, violet: combination 5 and black: combination 7. Solid lines represent reactions with 5 ng genomic DNA (E.coli) and dashed lines are non-template controls.