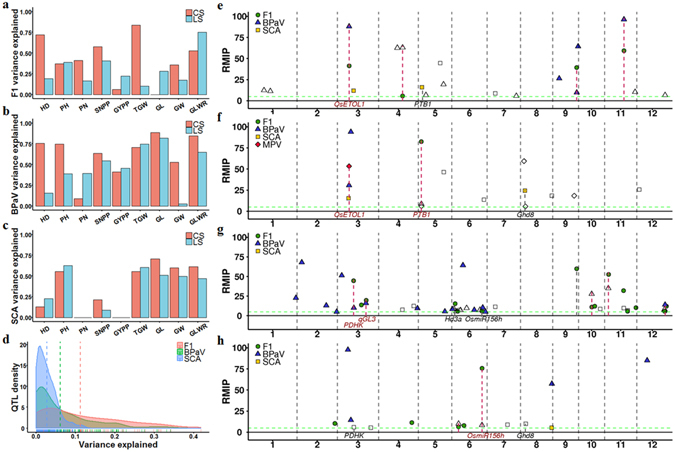
Figure 3.

GWAS results. (a) Total original phenotype variance of F1 hybrids explained by QTLs identified in F1 GWAS. (b) Total BPaV variance explained by QTLs identified in BPaV GWAS. (c) Total SCA variance explained by QTLs identified in SCA GWAS. (d) Frequency distribution of QTLs identified in F1 GWAS, BPaV GWAS, and SCA GWAS based on the variance explained by each QTL. The vertical dashed lines represent the average variance explained for the three QTL groups. (e,f) Manhattan plots of HD GWAS results for the CS dataset (E) and LS dataset (F). (g,h) Manhattan plots of SNPP GWAS results for the CS dataset (g) and LS dataset (h). Y-axis, RMIP in resample GWAS; red dashed lines, shared QTLs among different GWAS categories; open symbols, GWAS signals disappeared when using corresponding original F1 hybrid phenotypes as covariates.
