Fig. 2.

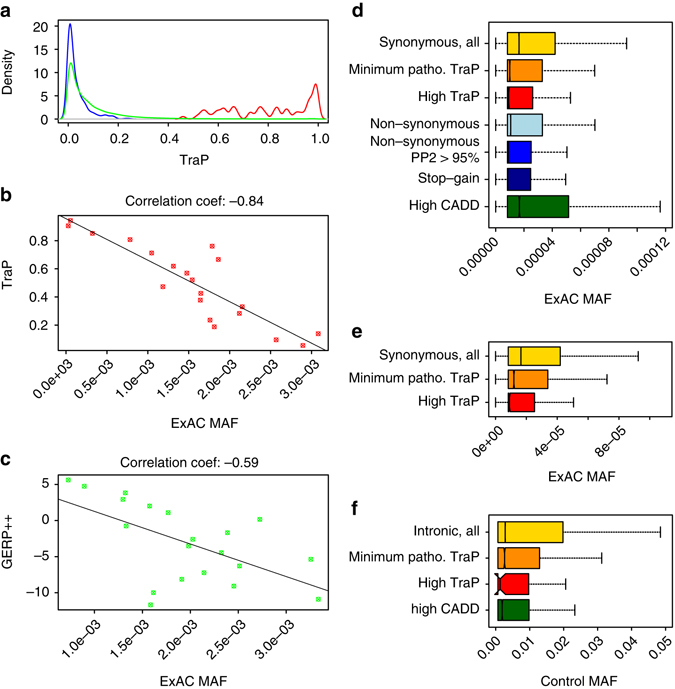
TraP and allele frequency of synonymous and intronic variants. a TraP density plots for training-set pathogenic variants (red), control DNMs (blue) and 1.46 M ExAC synonymous variants (green). b Correlation between TraP and MAF for 29,985 synonymous variants that create strong cryptic splice sites. The data set was binned into 20 groups by taking 5% score intervals and examining the correlation of the 20 points with the average MAF for each group. c Correlation between GERP++ score and MAF for 29,985 synonymous variants that create strong cryptic splice sites. The data set was binned 20 groups as in (b). d MAF distributions for different types of variants. MAF distribution for synonymous variants is presented with no Trap threshold (yellow), minimum pathogenic TraP (≥ 0.459, orange) and high TraP (≥ 0.93, red). Synonymous variants with high TraP (red), have significantly lower average MAF than NS variants (bright blue). MAF distribution of CADD top scoring synonymous variants (97.84th percentile) is also presented (green). e MAF distributions based on a non-GERP++TraP model for 1.46 M ExAC synonymous variants. Thresholds used differ from the final TraP model: minimum pathogenic TraP threshold used is the 25th percentile score (≥ 0.66, orange) and high TraP threshold is the 75th percentile score (≥ 0.955, red). f MAF distributions for 1.5 M intronic variants from 776 sequenced whole genomes. MAF distribution is presented for variants with no Trap threshold (yellow), minimum pathogenic TraP (≥ 0.459, orange) and high TraP (≥ 0.93, red). The whiskers of the boxplots extend to the most extreme data point, which is no more than 1.5 times the interquartile range away from the box
