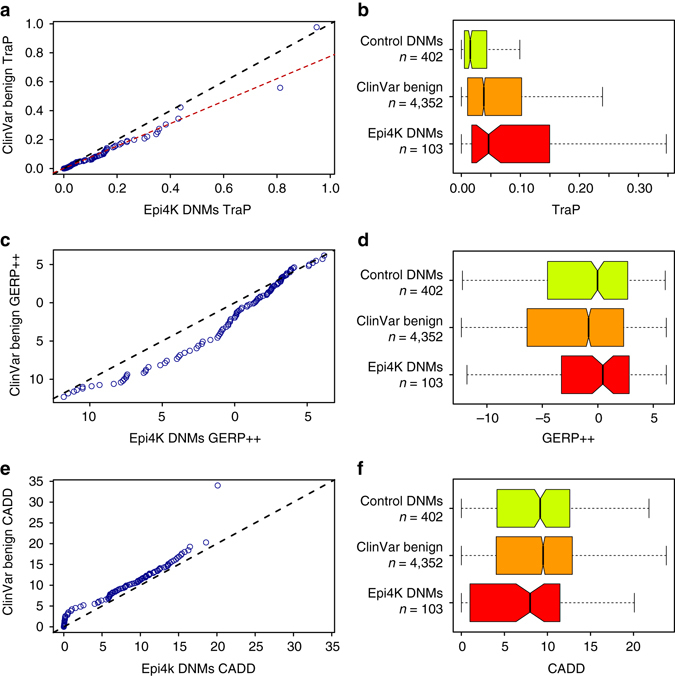
Fig. 4.

Epilepsy synonymous DNMs vs. ClinVar benign controls. A quantile–quantile plot for 103 Epi4K DNMs and 4,352 benign ClinVar synonymous variants is calculated for a TraP scores, c GERP++ scores and e CADD scores. Score distributions for training-set control DNMs, ClinVar benign variants and Epi4K DNMs are scored using b TraP, d GERP++ and f CADD.The whiskers of the boxplots extend to the most extreme data point, which is no more than 1.5 times the interquartile range away from the box
