Figure 3.

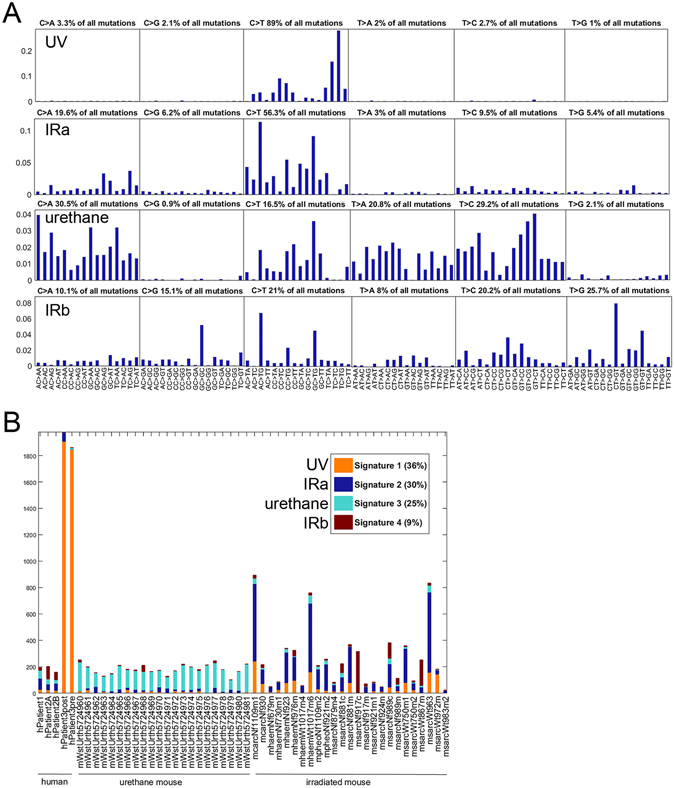
Mutational signatures in human and mouse malignancies induced by IR, UV or chemical mutagenesis. (A) The coefficients of 4 signatures from the 52 samples represented in (A and B). The majority (56.6%) of mutations represented by Signature 2 are C → T, but as seen in the first analysis, the neighboring bases differ markedly from the neighboring bases contributing to Signature 1, suggesting that the likelihood of C → T mutations to UV versus IR depends on the trinucleotide context. Signatures 3 and 4 are more complex than either of the others. Signature 3 has more C → A (31.2%) than any other type, with T → C, T → A and C → T all fairly prevalent. Signature 4 has approximately equal numbers of C → T, T → C and T → G mutations. (B) Shown are the number and proportion of mutations in each signature for each tissue sample when the 5 human tumors from the previous analysis are augmented with data from 25 IR-induced mouse samples and 22 urethane-induced mouse tumors. Signature 1 (UV) is still defined by the 2 samples from the skin cancer patient. However, adding the mouse tumors allows 2 IR signatures and one chemical signature (urethane, Signature 3) to be differentiated.
