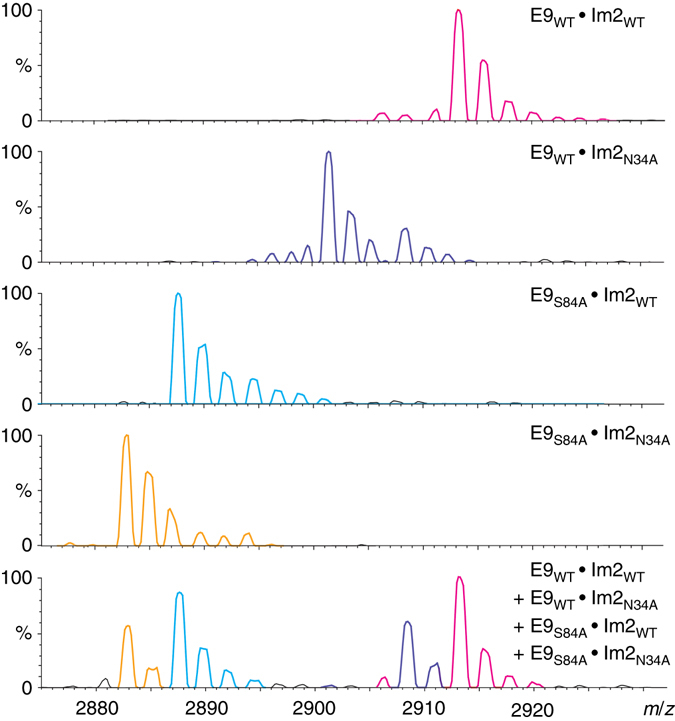
Fig. 3.

Interaction of Ser84 in E9 with Asn34 in Im2 studied by native MS. Representative mass spectra of the +9 charge state are shown for the four pairs of complexes: E9WT • Im2WT (magenta), E9WT • Im2N34A (purple), E9S84A • Im2WT (cyan), and E9S84A • Im2N34A (yellow). All these complexes were formed using equal concentrations of the two binding partners. The spectrum in the bottom panel corresponds to all four proteins mixed together at relative respective concentrations of E9WT, E9S84A, Im2WT, and Im2N34A of 1:2:2:1, respectively. The highly resolved mass spectrum generated for the mixture of E9WT, E9S84A, Im2WT, and Im2N34A enabled us to distinguish between the four different complexes that are formed. Note that some peaks, which are present when only one complex is formed, are absent when all four complexes are formed together because each protein now forms two different complexes at a ratio that depends on the concentrations of all four proteins and their affinities
