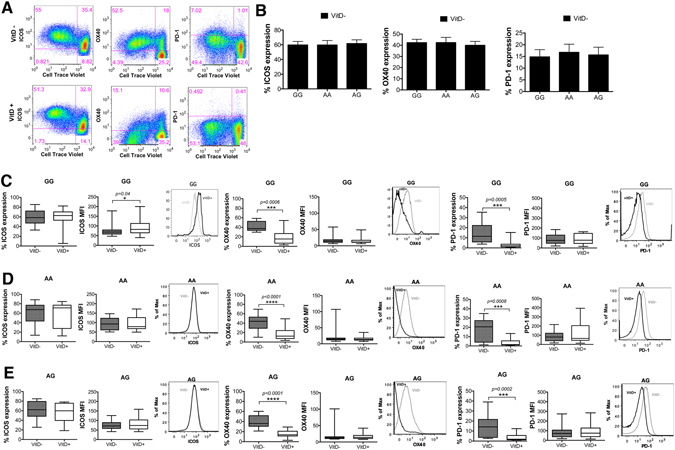
Figure 7.

AA, AG and GG individuals express similar levels of ICOS, OX40 and PD-1 molecules after T cell activation. CD4+CD25− T cells were activated in vitro with aCD3 antibody and CHO-CD80 cell line in the presence or absence of 1,25(OH)2D3 for 5 days. (A) Representative flow cytometry plots showing proliferating T cells expressing ICOS, OX40 and PD-1. (B) Percentage of proliferating cells that express ICOS, OX40 and PD-1 under no vitamin D treatment conditions (VitD−). (C–E) Data show the percentage of proliferating cells that express ICOS, OX40 and PD-1 and their respective median fluorescence intensity values for GG, AA and AG genotypes of the PSC CD28 risk allele locus. Representative overlay histograms showing the expression of each marker in the presence and absence of 1,25(OH)2D3. *p < 0.05, ***p < 0.001, ****p < 0.0001 using Wilcoxon matched-pairs signed rank test.
