
Figure 6.
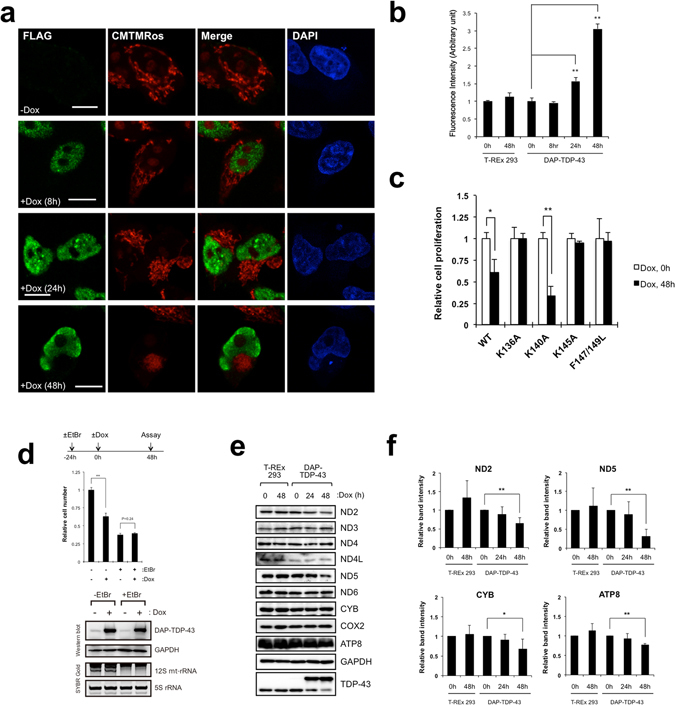
TDP-43 overexpression impairs mitochondrial function. (a) Exogenous TDP-43 was detected in DAP-TDP-43–expressing T-REx 293 cells by immunocytochemical analysis with anti-FLAG (green). Mitochondria were stained with CMTMRos (red) and nuclei with DAPI (blue). Cells were stained at 8, 24, or 48 h after doxycycline (Dox) induction. Bars, 10 µm. (b) Production of reactive oxygen species was measured in DAP-TDP-43–expressing T-REx 293 cells harvested at 0, 8, 24, and 48 h after Dox induction and in T-REx 293 cells harvested at 0 and 48 h after Dox treatment. The amount of reactive oxygen species (fluorescence intensity; arbitrary unit) per cell is relative to cells without Dox induction. Values are the average ± SD of three independent experiments. **P < 0.01 (unpaired t test). (c) Proliferation of T-REx 293 cells expressing DAP-TDP-43 or its point mutants relative to that of cells without Dox induction was measured by cell counting. Values are the average ± SD of three independent experiments. *P < 0.05. **P < 0.01 (unpaired t test). (d) DAP-TDP-43-expressing T-REx 293 cells treated with ( + EtBr) or without EtBr (−EtBr) for 24 h were induced with Dox (+Dox) for 48 h, and numbers of cells relative to both −EtBr and −Dox cells were counted. **P < 0.01 (unpaired t test). The expression of DAP-TDP-43 was examined by western blotting with anti-TDP-43 and anti-GAPDH. The inhibition of mt transcription by EtBr was confirmed with SYBR Gold staining of 12S mt-rRNA. (e,f) Mitochondrial proteins prepared from T-REx 293 cells or from DAP-TDP-43-expressing T-REx 293 cells harvested at 0, 24, and 48 h after Dox induction (Dox) were analysed by western blotting with the indicated antibodies (e). Intensities of the immunostained bands in e were quantified relative to those at 0 h of Dox induction. Only the proteins for which the level changed upon overexpression of TDP-43 are shown (f). Data are the mean ± SD, n = 3–5. *P < 0.05, **P < 0.01 (paired t test).