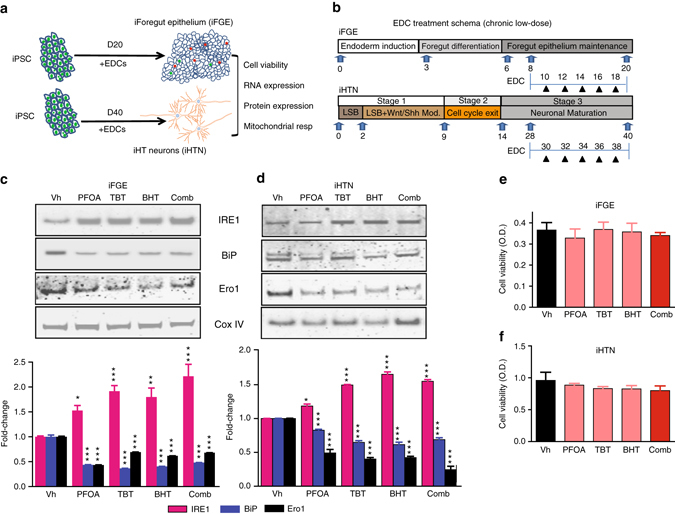
Fig. 3.

Chronic low-dose EDC treatment induces ER stress in iFGEs and iHTNs without affecting cell viability. a A schematic representation of EDC treatments and analysis performed on iFGEs and iHTNs. b A schematic showing the kinetics of EDC treatments performed on iFGEs and iHTNs. c, d Representative immunoblots showing levels of bona fide ER-stress pathway proteins, IRE1, BiP, and Ero1, in c iFGE and d iHTNs. Quantified histograms using ImageJ-based densitometry of bands for each of the respective protein immunoblots normalized to Cox IV as loading control are shown below and represented as fold-change compared with vehicle-treated control. IRE1 protein increases, whereas BiP and Ero1 levels decrease in response to EDC exposure, *p < 0.05, **p < 0.01, ***p < 0.001. e, f MTT assay shows no significant differences in cell viability upon EDC exposure in both e iFGEs and f iHTNs. All statistical analyses were performed using one-way ANOVA. Data shown are representative of average results from the two iPSC lines differentiated n = 3 times in independent experiments. Error bars denote s.e.m
