Figure 1.

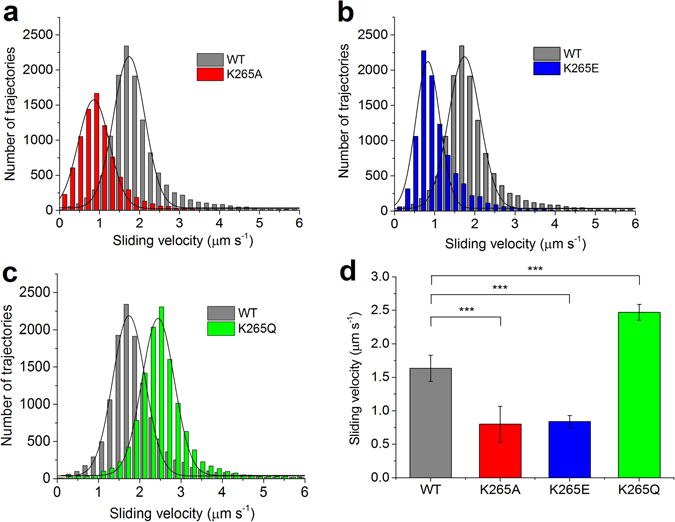
Sliding velocity of actin filaments on WT and mutant myosin-decorated surfaces as determined by in vitro motility assays. (a–c) The histograms and Gaussian fits show typical distributions and average sliding velocities of actin filaments on lawns of WT compared to K265A, K265E and K265Q myosin lawns. (d) The bar graph represents the mean values of 7–10 different experiments with one or two protein preparations; the error bars show the standard deviation. The differences in sliding velocity obtained for the mutants were significant as compared to WT (*** for p < 0.0005).
