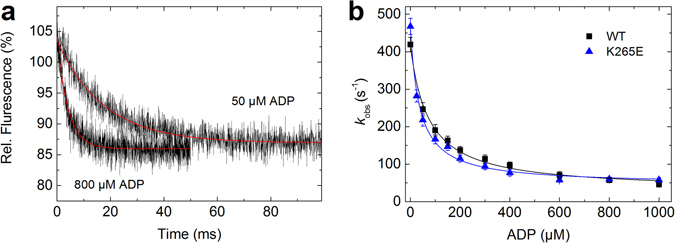
Figure 10.

ADP inhibition of ATP-induced dissociation of acto-myosin complexes for WT and K265E. (a) The inhibition of the ATP-induced dissociation of the acto-myosin complex was followed by the exponential decrease in the light scattering signal. The graph shows sample traces for the WT at 50 and 800 µM ADP. (b) The plot of the observed rate constants versus the ADP concentration was fit by a hyperbola to give k -AD and K AD. The error bars report the standard deviation for three independent experiments (see Table 2).
