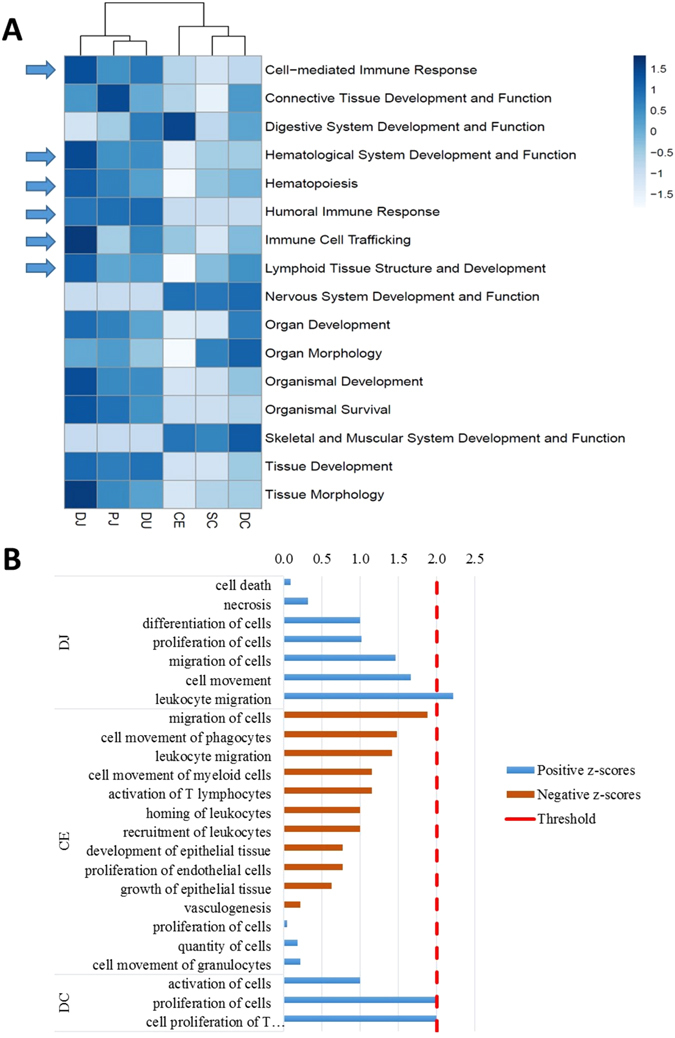
Figure 3.

Function analysis for core transcriptome of cattle intestinal tissues. (A) IPA (Ingenuity Pathway Analysis) functional analysis of the core transcriptome of intestinal tissues. The heatmap shows scaled values of −log10(p-value) indicated with blue colours: the darker the blue, the more likelihood that a function is associated with the core transcriptome of a tissue. (B) Functional analysis for differentially expressed (DE) genes. Results obtained from IPA downstream analysis for DE genes of each tissue. Positive z-scores were indicated with blue bars and negative z-scores with brown bars. The absolute values of z-scores were plotted, and those with a threshold greater than 2 hr, considered to indicate a difference in functionality between super-shedders and non-shedders. A positive z-score indicates enhancement, while a negative z-score indicates a reduction in function. DJ, distal jejunum; CE, cecum; SC, spiral colon; DC, descending colon; for differentially expressed genes identified in the other tissues, no IPA functional terms were enriched.
