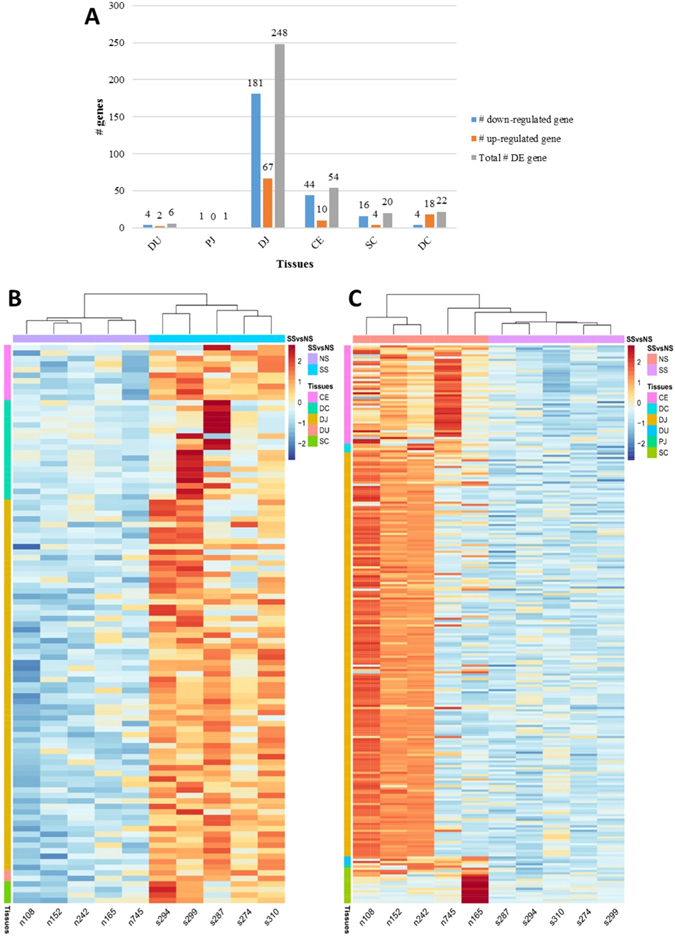
Figure 4.

Differentially expressed genes between super-shedders and non-shedders. (A) Number of differentially expressed (DE) genes identified in intestinal regions. DE genes: FDR < 0.05, log2(fold change) <−1 or >1, cpm ≥1 in at least 50% of SS and NS. (B) and (C) are Heatmaps for log2(counts per million) of differentially expressed genes in all tissues: (B) up-regulated differentially expressed genes in super-shedders; (C) down-regulated differentially expressed genes in super-shedders. Scaled log2(counts per million) was indicated by red and blue colors, and red indicates higher expression level, while blue colour indicates lower expression level. The column labels indicate super-shedders and non-shedders: NS, non-shedders; SS, super-shedders. The row labels indicate the tissue where differentially expressed genes were identified. DU, duodenum; PJ, proximal jejunum; DJ, distal jejunum; CE, cecum; SC, spiral colon; DC, descending colon.
