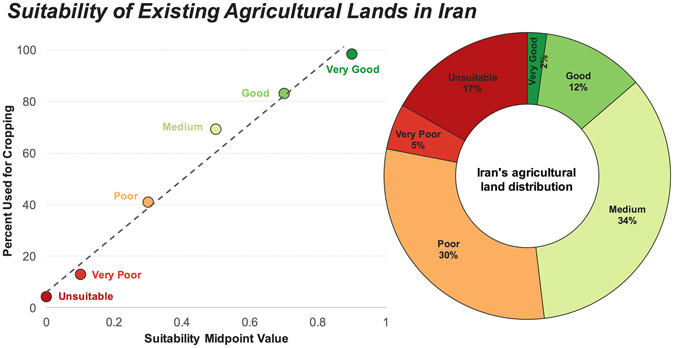
Figure 6.

Land suitability of existing croplands. Distribution of Iran’s agricultural lands (cultivated or uncultivated) among different suitability classes corresponding to Fig. 6. Left figure shows the percentage of the land within each of the suitability classes that have been used for cropping. The donut chart (right) shows the proportion of Iran’s total agricultural area that falls within each suitability class. The slope, intercept, and R2 values for the linear regression model (dashed line) are 108.8, 6.2 and 0.98, respectively.
