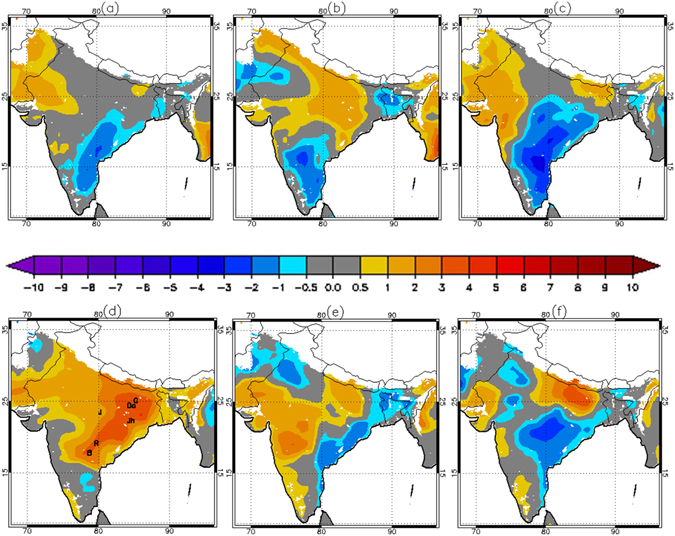
Figure 1.

Weekly anomaly of SAT (°C) for the weeks of (a) April 30th–May 1st to May 6th−7th, (b) May 7th−8th to May 13th−14th, (c) May 14th−15th to May 20th−21st, (d) May 21st−22nd to May 27th−28th, (e) May 28th−29th to June 3rd−4th and (f) June 4th−5th to June 10th−11th in 2015 based on the weekly climatology of 1980–2015. Station locations (G = Goya, Da = Daltonganj, Jh = Jharsuguda, J = Jabalpur, R = Ramgundam and B = Begumpet Airport) are marked in Fig. 1d. Any pixel with elevation above 1000 m is not shown (white colored region). Data visualizations produced using IDL [8.4] (Exelis Visual Information Solutions, Boulder, Colorado).
