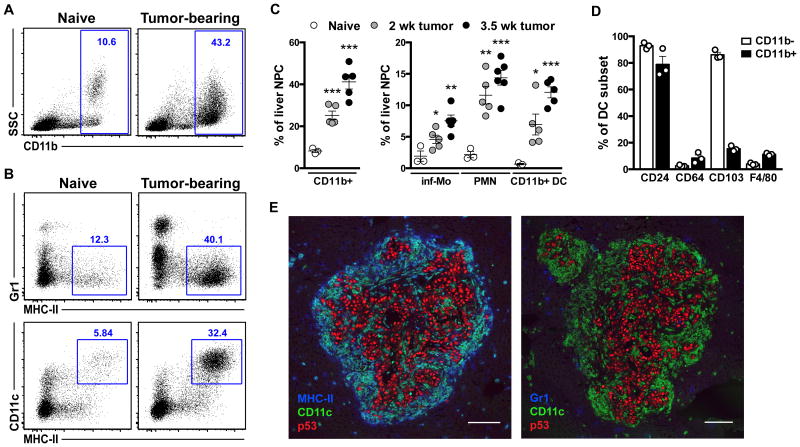
Figure 1. CD11b+ DC accumulate at secondary sites and surround early metastases.
(A-C) Liver non-parenchymal cells (NPC) were analyzed by flow cytometry at the indicated time points following pancreatic tumor implantation or 2 wk after sham operation for naïve mice. (A, B) Representative plots depicting total CD11b+ cells among NPC (A) and markers expressed by CD11b+ cells from naïve and 3.5 wk tumor-bearing mice (B). (C) Frequencies of CD11b+ cells and subsets in naïve and tumor-bearing mice with means ± SEM shown. (D) Marker expression by CD11b- and CD11b+ DC (CD11chiMHC-IIhi) subsets from tumor-bearing mice with means ± SEM shown. (E) Micrometastatic liver sections stained with the indicated antibodies. Tumor cells are marked by the accumulation of mutant p53. Scale bar, 100 μm. *, p<0.05; **, p<0.01; ***, p<0.001 by Student's t-test comparing tumor-bearing to naïve mice. See also Fig. S1.

