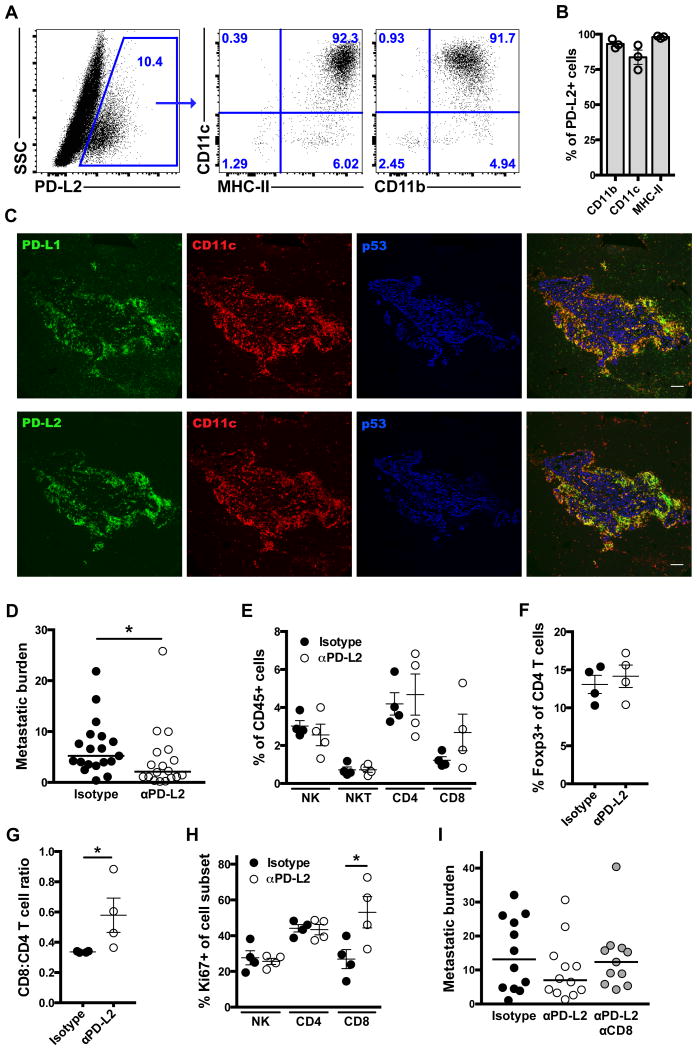
Figure 6. CD11b+ DC inhibit CD8 T cell-mediated tumor immunity through PD-L2.
(A, B) Total PD-L2+CD45+ cells from micrometastatic liver are gated (A) and their phenotype displayed (A, B), with means ± SEM shown. (C) Micrometastatic liver tissue sections stained with the indicated antibodies. Scale bar, 100 μm. (D) Metastatic burden with medians shown for orthotopic tumor-bearing mice treated with the indicated antibodies. (E-H) Means ± SEM of cells with indicated phenotypes and cell ratios after 10 d of antibody treatment. (I) Metastatic burden with medians shown for mice treated with indicated antibodies following intrasplenic tumor cell injection. *, p<0.05 by Mann-Whitney U-test (D, G) or Student's t-test (H). See also Fig. S6.

