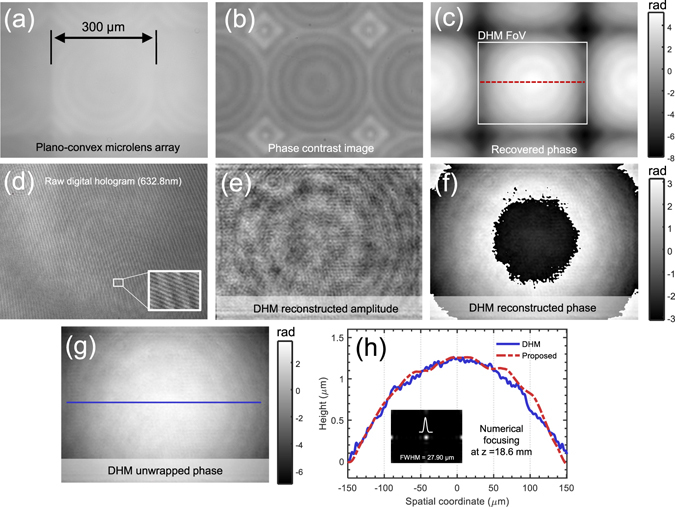
Figure 13.

Microlens array characterization using AI-TIE. (a) In-focus intensity image. (b) Phase contrast microscope image. (c) Reconstructed phase image by AI-TIE. (d) Digital hologram captured by a DHM system. The carrier fringes can be easily seen in the magnified area. (e) DHM reconstructed amplitude. (f) DHM reconstructed (wrapped) phase. (g) Unwrapped phase. (h) Height line profiles corresponding to the red dashed line in (c) and the blue solid line in (g), respectively.
