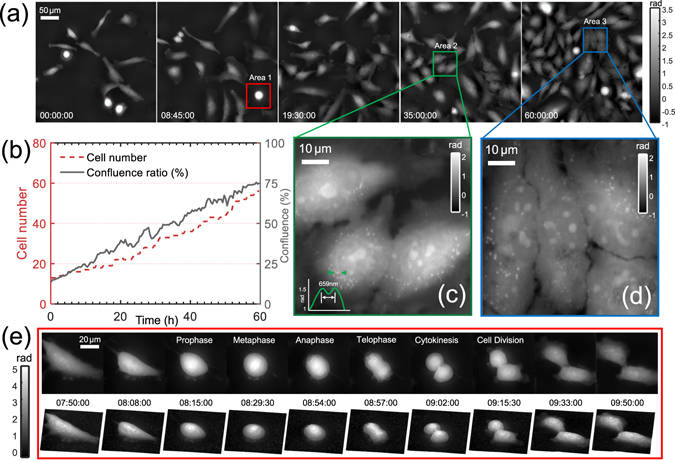
Figure 14.

Time-lapse phase imaging of HeLa cell division over a long period (60 h). (a) Representative quantitative phase images at different time points. (b) The change of cell number and confluence ratio over the culture passage period. (c) and (d) show the magnified views corresponding to two regions of interest (Area 2 and Area 3). (e) 10 selected time-lapse phase images and the corresponding 3D renderings showing the morphological features of a dividing cell (Area 1) at different stages of mitosis.
