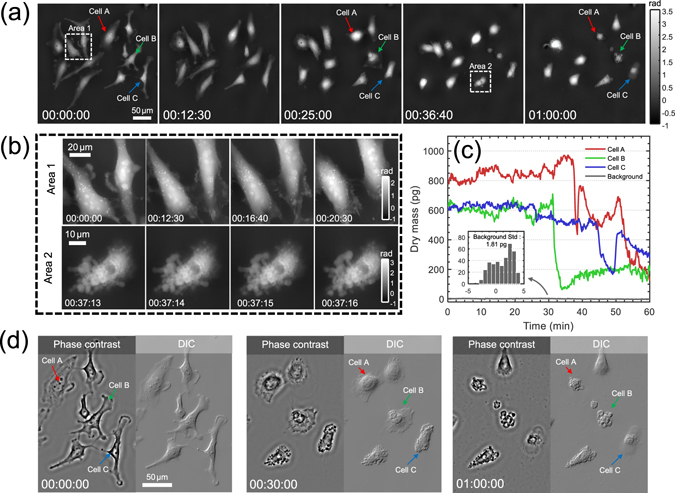
Figure 15.

Multi-modal computational imaging of apoptotic HeLa cells induced by paclitaxel. The phase is reconstructed every second from the beginning of the drug treatment. (a) 5 representative quantitative phase images spanning over 1 h. (b) Magnified views at different time points corresponding to regions of interest (Areas 1 and 2). (c) Dry mass changes of three labeled cells during apoptosis. (d) Simulated phase contrast and DIC images at three time points.
