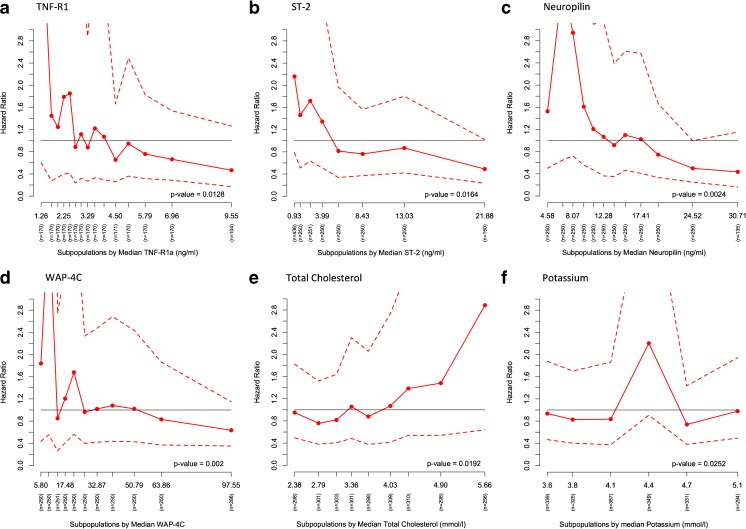
Fig. 3.
Subpopulation Treatment Effect Pattern Plot analysis of the treatment effects of rolofylline vs. placebo treatment effect measured by hazard ratio (<1 rolofylline better than placebo), with corresponding 95% confidence interval bands. y-axis: hazard ratio, x-axis: subpopulations by median. a TNF-R1α, tumor necrosis factor receptor 1 alpha levels (ng/mL) p value = 0.0128; b ST2 levels (ng/mL) p value = 0.0162; c neuropilin levels (ng/mL) p value = 0.0024. d WAP-4C, WAP four-disulfide core domain protein HE4 levels (ng/mL) p value = 0.002; e Total cholesterol (mmol/L) p value = 0.0192. f Potassium (mmol/L) p value = 0.0252

