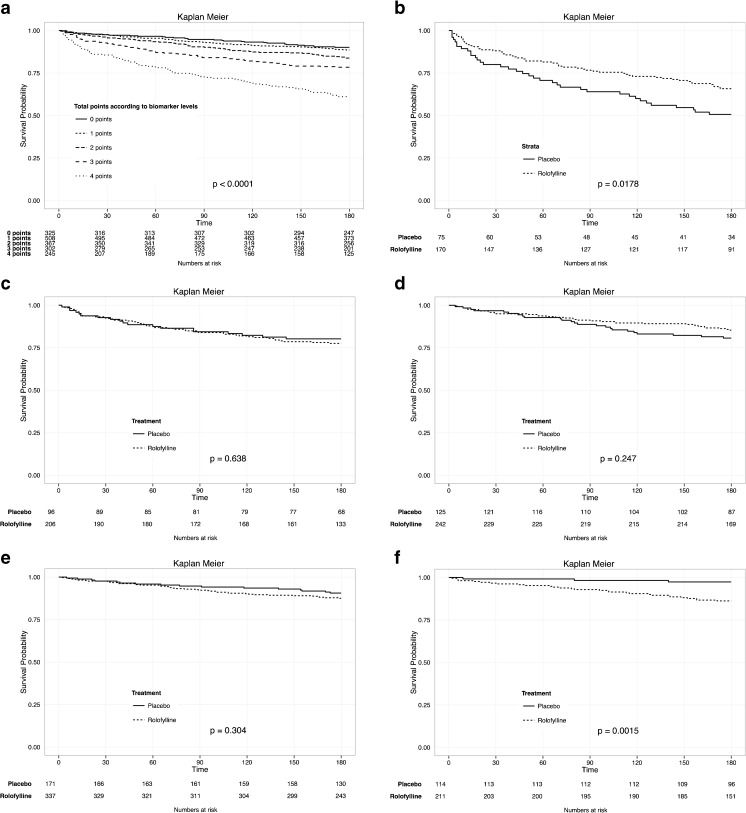
Fig. 4.
a Kaplan-Meier survival curves according to points subgroup. Unadjusted Kaplan-Meier survival curves according to total points based on biomarker response score chart. Log rank ≤0.0001. b Unadjusted Kaplan-Meier estimates of survival in patients with four points, according to treatment group. Log rank = 0.0178. c Unadjusted Kaplan-Meier estimates of survival in patients with three points, according to treatment group. Log rank = 0.638. d Unadjusted Kaplan-Meier estimates of survival in patients with two points, according to treatment group. Log rank = 0.247. e Unadjusted Kaplan-Meier estimates of survival in patients with one point, according to treatment. Log rank = 0.304. f Unadjusted Kaplan-Meier estimates of survival in patients with zero points, according to treatment. Log rank = 0.0015

