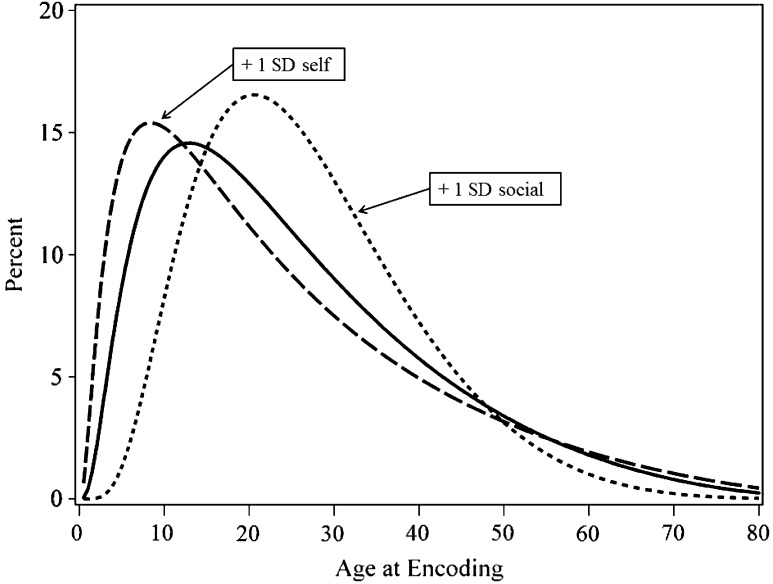
Fig. 2.
The effects of using reported autobiographical memories for self- and social functions on their memory distribution. The solid line represents the average distribution, the dotted lines represents the autobiographical memory distributions for individuals scoring one standard deviation above (+1 SD) the respective means

