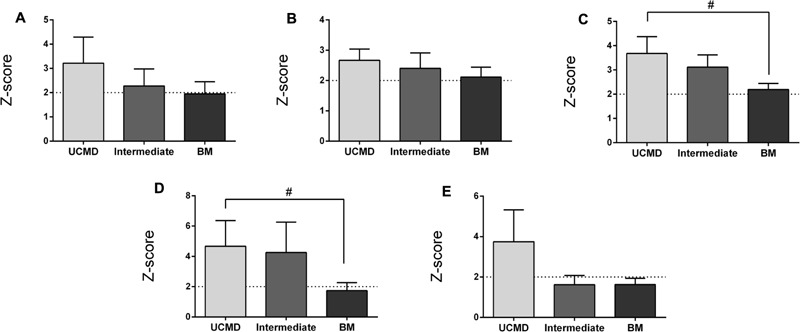
FIGURE 2.

Changes in amount of fat mass by DXA in UCMD, intermediate phenotype and BM patients in whole body normalized to height squared (fat mass index, FMI) (A), gynecoid region (B), legs (C), trunk (D), and android region (E). Results are expressed as mean on Z-score for each group. Threshold of significance was considered when Z-score ≥ 2 or Z-score ≤ –2 and was indicated with dotted line. #P ≤ 0.05.
