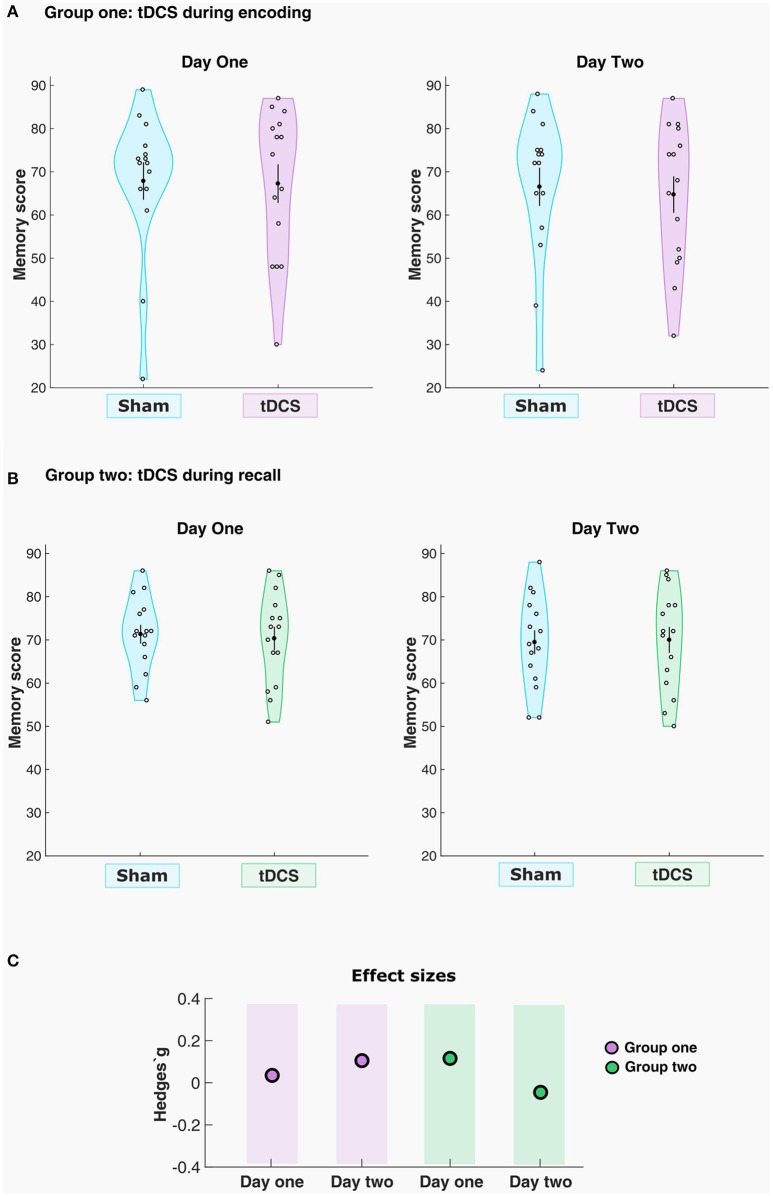
Figure 3.
tDCS had no significant effects on memory performance. The violin plots indicate the density of the sample distribution across the y-values. Mean and standard error of the mean (SEM) are shown in each plot as the black dot and the black line (A) Memory score for sham and real stimulation conditions for each participant in group one, day 1 and 2, respectively. (B) Memory score for sham and real stimulation conditions for each participant in group two, day 1 and 2, respectively. (C) Effect sizes for the real tACS conditions across the two groups.

