Figure 1.

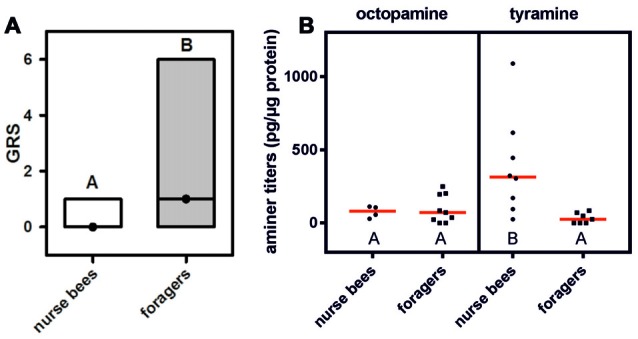
Gustatory responsiveness and tyramine titers in the fat body differ between nurse bees and foragers. (A) Gustatory response scores (GRSs) of foragers and nurse bees. Medians (dots) and upper and lower quartiles (lines) are displayed. Groups with different letters differ significantly (P at least <0.05, Mann Whitney U test). (B) Octopamine and tyramine titers in the fat bodies of nurse bees and foragers. Figures display individual data points and medians (red lines). Groups with different letters differ significantly (P at least <0.05, Mann Whitney U test).
