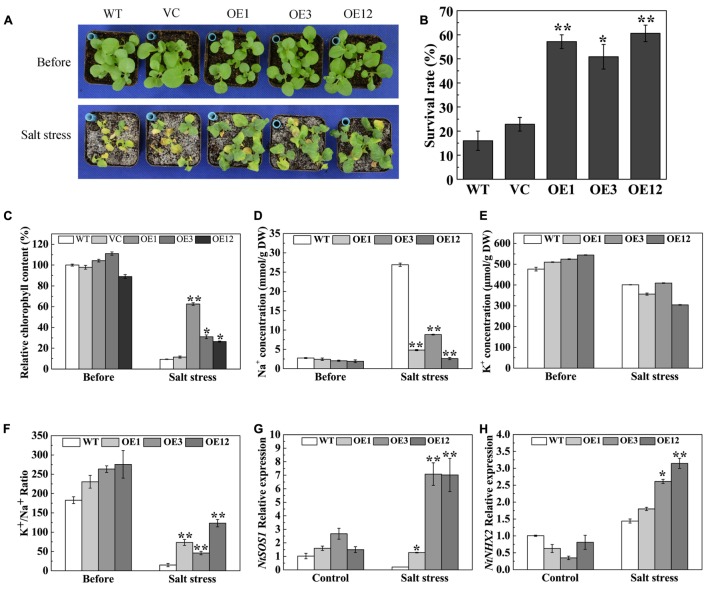
FIGURE 6.
Salt tolerance of TaODORANT1 overexpressed tobacco plants. (A) Phenotype of WT, VC and OE lines (OE1, OE3, and OE12) after salt treatment. (B) Survival rate statistical analysis. (C) Chlorophyll content in leaves. (D,E) Na+ and K+ concentrations in leaves. (F) K+/Na+ ratio. (G,H) Expression levels of ion transporter genes. Three independent biological replicates were performed and produced similar results. Vertical bars refer to ±SE (n = 3). Asterisks indicate significant difference between the WT and the transgenic lines (∗P < 0.05; ∗∗P < 0.01).

