
Figure 3.
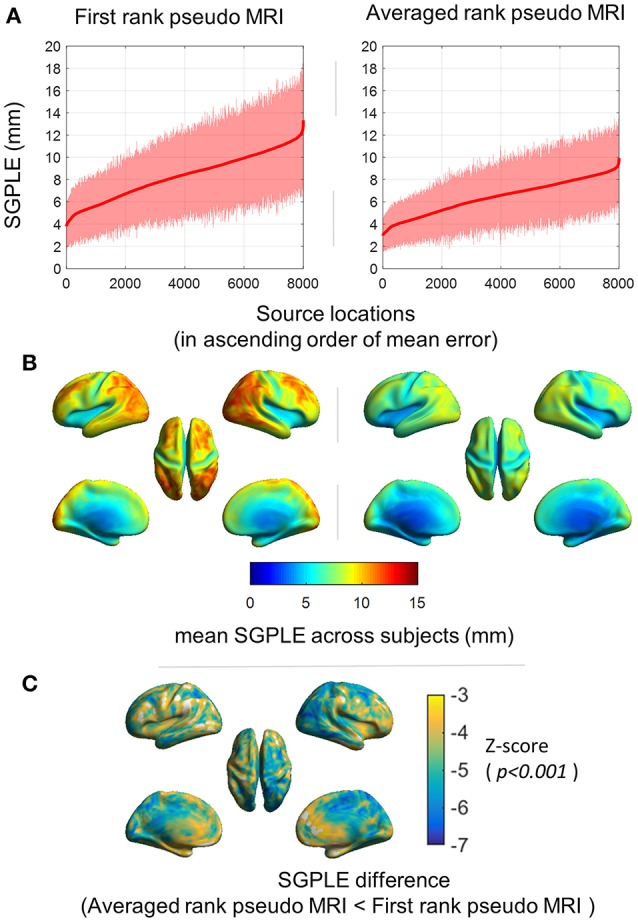
Spatial distribution of the sourcemodel grid point location error (SGPLE). (A) SGPLE for each of sourcemodel grid point locations across the subjects (mean ± standard deviation) where locations are ordered according to mean SGPLE. (B) Spatial distribution of mean of SGPLE across the subjects. (C) Spatial distribution of SGPLE difference (p < 0.001, Wilcoxon signed-rank test, n = 92 subjects) between first rank pseudo MRI and averaged rank pseudo MRI.