Figure 5.
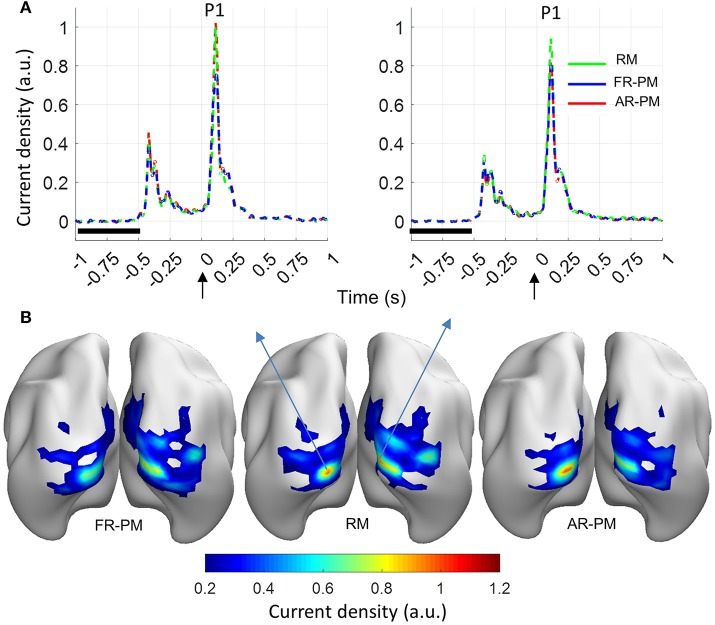
Functional group source response (event-related power [ERP]) from visual stimulation (averaged over 100 group iterations for 20 subjects in a group). (A) ERP time series for source locations with peak source activity at latency of 0.108 s (P1 peak) in left and right visual cortices. Baseline period: −1 to −0.5 s, Stimulus onset: 0 s. (B) Current density distribution for ERP peak (P1 component). a.u. arbitrary unit where a.u. = 1 corresponds to maximum source ERP value over the cortex for the real MRI. RM, real MRI; FR-PM, First rank pseudo MRI; and AR-PM, averaged rank pseudo MRI.

