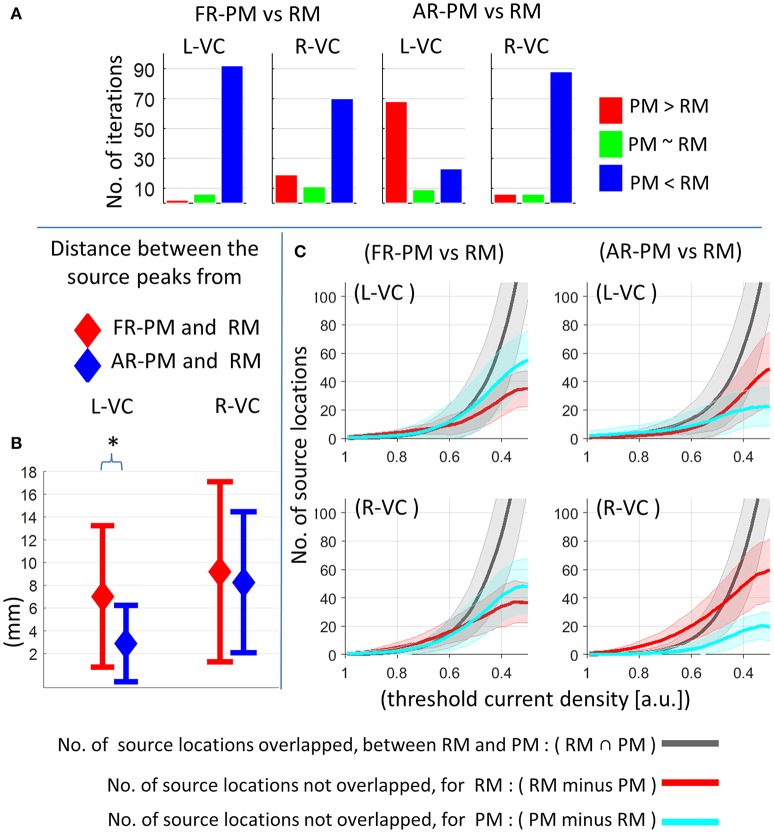
Figure 6.
Comparison of functional group source ERP response between pseudo MRI and real MRI for 20 subjects in a group and 100 group iterations. (A) Comparison of peak source ERP magnitude for different group iterations. Y-axis represents number of group iterations showed significant difference for peak source ERP magnitude (p < 0.01: blue and red bar, p > 0.01: green bar, bootstrap approach). (B) Peak source localization error across the group iterations (mean ± standard deviation). *p < 0.01, Wilcoxon signed-rank test, n = 100 group iterations. (C) Overlap of activation region (no. of grid point locations) between real MRI and pseudo MRI after applying different levels of threshold value across the group iterations (mean ± standard deviation). RM, real MRI; PM, pseudo MRI; FR-PM, first rank pseudo MRI; AR-PM, averaged rank pseudo MRI; L-VC, left visual cortex; R-VC, right visual cortex; a.u., arbitrary unit where a.u. = 1 corresponds to maximum source ERP value for a given group iteration in visual cortex for real MRI.

