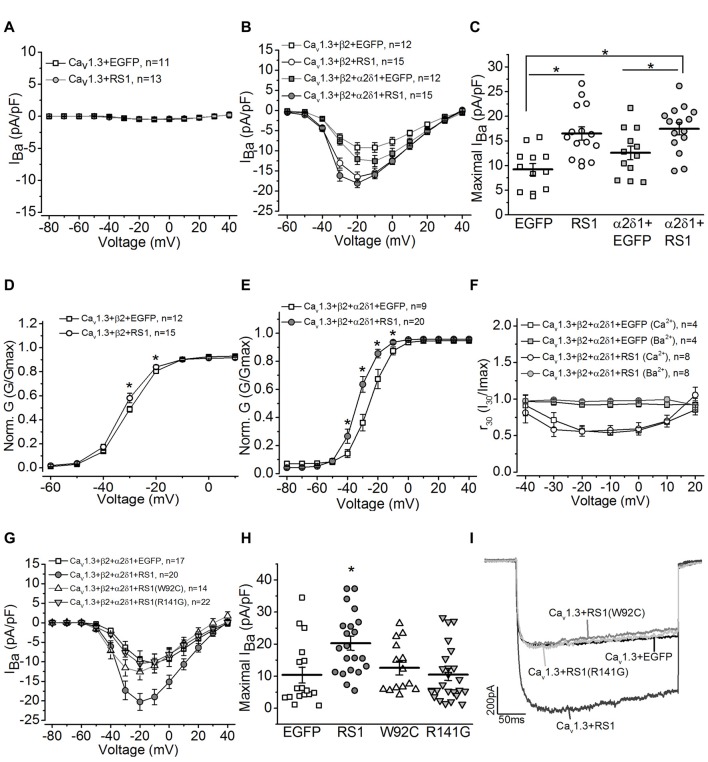
Figure 2.
RS1 augments the current density of Cav1.3-LTCC in HEK cells. (A) Cells transfected with Cav1.3 subunit without other LTCC auxiliary subunits (Cav1.3 + EGFP) do not have functional LTCCs. Co-transfection with Cav1.3 and RS1 do not elicit LTCC currents carried by Ba2+ (IBa). (B) Cells transfected with Cav1.3 and β2 (Cav1.3 + β2 + EGFP), or Cav1.3, β2, and α2δ1 (Cav1.3 + β2 + α2δ1 + EGFP) display functional Cav1.3-LTCC currents. RS1 significantly enhances Cav1.3-LTCC when co-transfected with functional Cav1.3-LTCC (Cav1.3 + β2 + RS1, or Cav1.3 + β2 + α2δ1 + RS1). (C) The maximal current densities (IBa) elicited at −20 mV are (in pA/pF): −9.22 ± 1.20 for EGFP (Cav1.3 + β2 + EGFP), −16.51 ± 1.27 for RS1 (Cav1.3 + β2 + RS1), −12.58 ± 1.40 for α2δ1 + EGFP (Cav1.3 + β2 + α2δ1 + EGFP), and −18.06 ± 1.13 for α2δ1 + RS1 (Cav1.3 + β2 + α2δ1 + RS1). *Indicates a significant difference between the groups (*p < 0.05, one-way ANOVA with Tukey’s post hoc tests). EGFP vs. RS1, p = 0.00138; α2δ1 + EGFP vs. α2δ1 + RS1, p = 0.0273; EGFP vs. α2δ1 + RS1, p = 0.000260. (D,E) Co-transfection with RS1 significantly enhances the voltage-dependent activation of Cav1.3-LTCCs in the presence or absence of α2δ1 subunit. *Indicates that the Cav1.3-LTCC voltage-dependent activation recorded from cells transfected with Cav1.3 + β2 + α2δ1 + RS1 and Cav1.3 + β2 + RS1 are significantly larger than the other two groups without RS1 (*p < 0.05; unpaired Student’s t-test). The normalized conductance (Norm. G) is the ratio of conductance (G) against the maximal conductance (Gmax), G/Gmax, and plotted against the elicited membrane voltage (mV). *Indicates a statistical difference between the two groups (*p < 0.05; unpaired Student’s t-test). Cav1.3 + β2 + EGFP vs. Cav1.3 + β2 + RS1: p = 0.04505 at −30 mV, p = 0.02138 at −20 mV. Cav1.3 + β2 + α2δ1 + EGFP vs. Cav1.3 + β2 + α2δ1 + RS1: p = 0.0456 at −40 mV, p = 0.00278 at −30 mV, p = 0.0035 at −20 mV, p = 0.01509 at −10 mV. (F) RS1 does not alter the calcium-induced inactivation (CDI) of Cav1.3-LTCCs. Cells with functional Cav1.3-LTCC (Cav1.3 + β2 + α2δ1) in the presence or absence of RS1 co-expression were recorded with Ba2+ or Ca2+ as the Cav1.3-LTCC current carriers. The Cav1.3-LTCC currents carried by Ca2 +, but not Ba2 +, display CDI. (G) Co-transfection with the RS1 mutants (W92C or R141G) and a fully functional Cav1.3-LTCC (Cav1.3 + β2 + α2δ1) does not enhance Cav1.3-LTCC currents. (H) The maximal Cav1.3-LTCC current densities (IBa) elicited at −20 or −10 mV are (in pA/pF): −10.39 ± 3.44 for EGFP (Cav1.3 + β2 + α2δ1 + EGFP), −20.27 ± 2.19 for RS1 (Cav1.3 + β2 + α2δ1 + RS1), −12.59 ± 2.06 for W92C (Cav1.3 + β2 + α2δ1 + W92C), and −10.47 ± 1.86 for R141G (Cav1.3 + β2 + α2δ1 + R141G). *Indicates that co-transfection with RS1 significantly increases the maximal Cav1.3-LTCC current density compared to the other three groups (*p < 0.05, one-way ANOVA with Tukey’s post hoc tests). EGFP vs. RS1, p = 0.00893; R141G vs. RS1, p = 0.00791; W92C vs. RS1, p = 0.052; W92C vs. EGFP, p = 0.9655; R141G vs. EGFP, p = 0.9981. (I) Representative current traces recorded from cells transfected with a fully functional Cav1.3-LTCC (Cav1.3 + EGFP) and co-transfected with Cav1.3-LTCC and RS1 or RS1 mutants (W92C or R141G) are presented.

