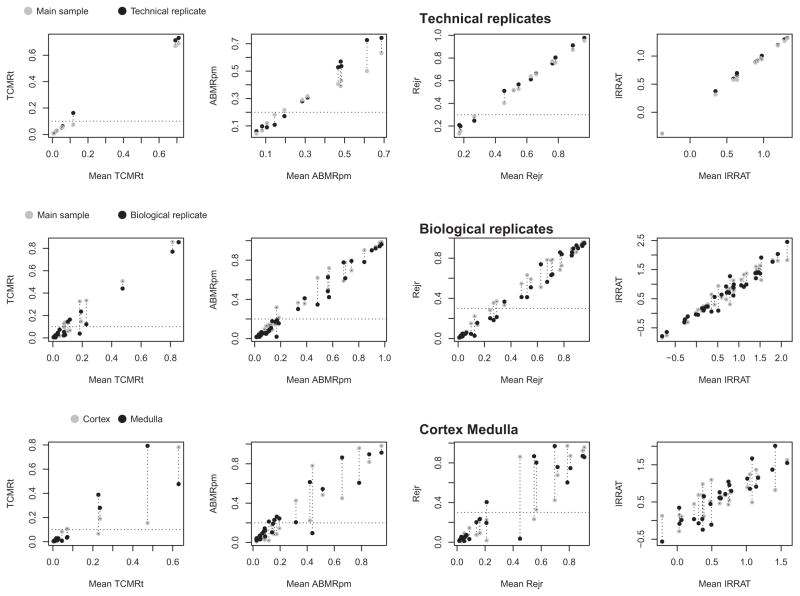
Figure 8. Reproducibility plots of the molecular scores of rejection (TCMR, ABMR, all rejection) and acute kidney injury (IRRAT) in the technical and biological replicates and in the cortex–medulla divided pairs.
Dotted horizontal line indicates the positive/negative cutoffs for the molecular scores. The y-axes are the scores for the two samples compared for the TCMR, ABMR, and Rejection classifiers (a number between 0 and 1.0) or the geometric mean of the expression of the AKI transcripts (IRRATs). The x-axis is the mean of classifier or IRRAT scores. ABMR, antibody-mediated rejection; AKI, acute kidney injury; IRRAT, acute kidney injury transcripts; TCMR, T cell–mediated rejection.

