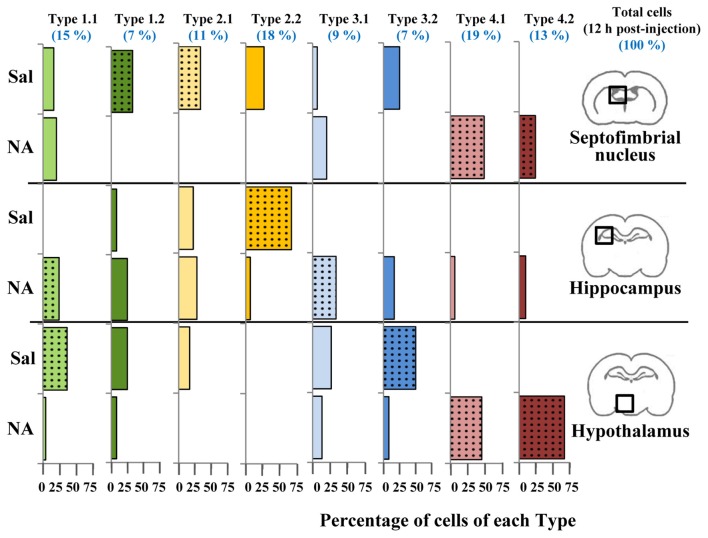
Figure 10.
Distribution of microglial cell Types in different brain areas. Microglial cells from 12 h post-injection animals were classified using the previously proposed decision tree. For each cell Type, the distribution (percentage) of cells in different brain areas (septofimbrial nucleus, hippocampus and hypothalamus) and treatments (saline/NA) was plotted as histogram. Color of bars indicate Cluster origin (same color code as Figure 7), using light color for Type x.1 and dark for Type x.2. At the top in blue, the distribution (percentage) in Types of the total cells analyzed (about 150 cells) is indicated. Dotted bars indicate the most representative microglial Type for each brain region and treatment.

