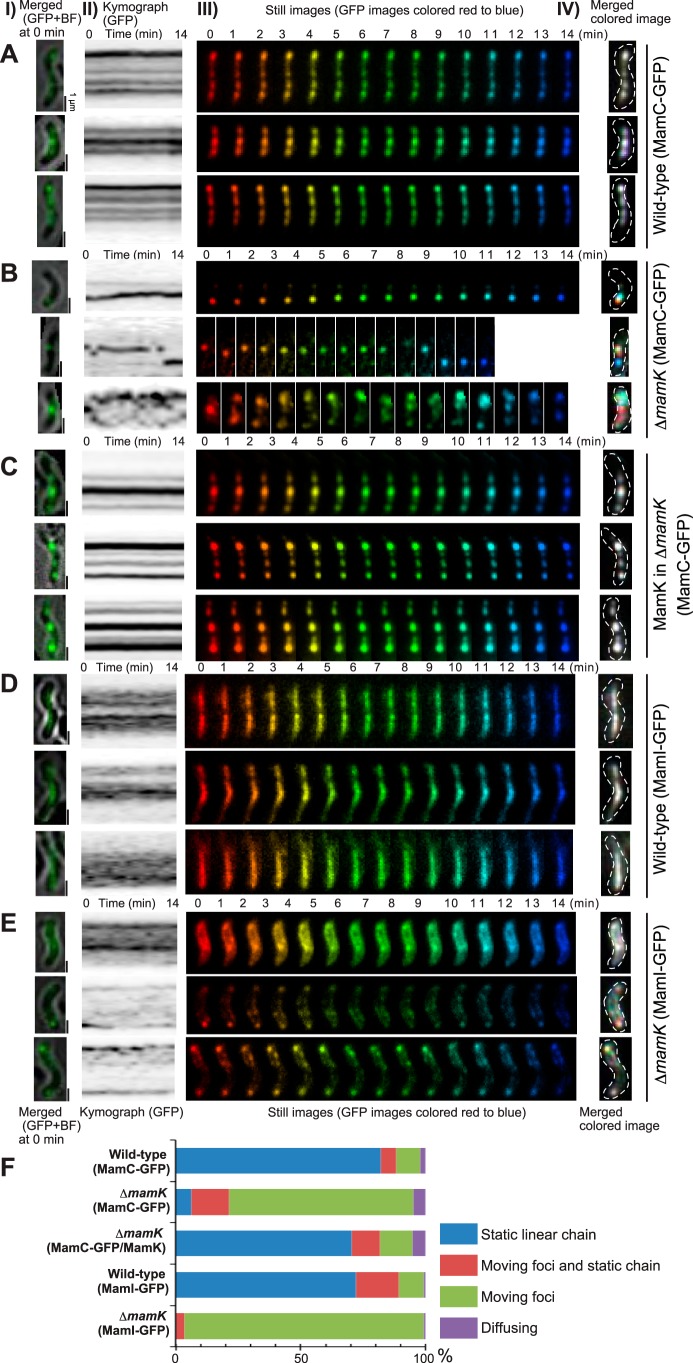
FIG 1 .
Dynamics of magnetosomes. Magnetosomes were visualized using MamC-GFP (A to C) and MamI-GFP (D and E) in wild-type (A and D), ΔmamK deletion mutant (B and E), and MamK-complemented ΔmamK deletion mutant (C) cells, respectively. (Column I) Merged GFP and bright-field images of cells at time zero. Scale bars, 1 µm. (Column II) Kymographs of the GFP trajectory in maximum projections. (Column III) Time-lapse still images acquired during a 14-min interval are sequentially rainbow colored, red to blue. (Column IV) Merged images of the rainbow-colored still images in column III. White indicates the static GFP signal, and colored signals show the dynamic GFP signal. The images show that MamK is dynamic in ΔmamK deletion mutant cells and static in wild-type and MamK-complemented cells over a time scale of minutes. (F) Dynamic localization patterns of magnetosomes. The dynamics of magnetosomes were determined based on time-lapse observation for 3 h in MamC-GFP-expressing wild-type cells (n = 107) and in ΔmamK mutant cells (n = 122) and in MamI-GFP-expressing wild-type cells (n = 141) and in ΔmamK mutant cells (n = 145). For the complementation experiment, wild-type MamK was coexpressed with MamC-GFP in deletion mutant ΔmamK cells (n = 192). In ΔmamK mutant cells, magnetosomes labeled with both MamC-GFP and MamI-GFP were mostly dynamic, whereas wild-type and MamK-complemented cells had mostly static magnetosomes.

