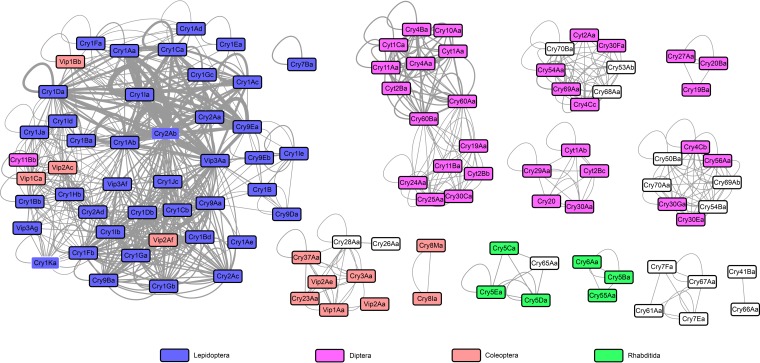
FIG 5 .
Co-occurrence network of all of the Cry, Cyt, and Vip proteins predicted in this study. Nodes represent different Cry proteins, and node colors represent their targets. Cry proteins that coexist in the same strain are represented by edge, and those that coexist more frequently are connected by thicker lines.

