
Figure 1.
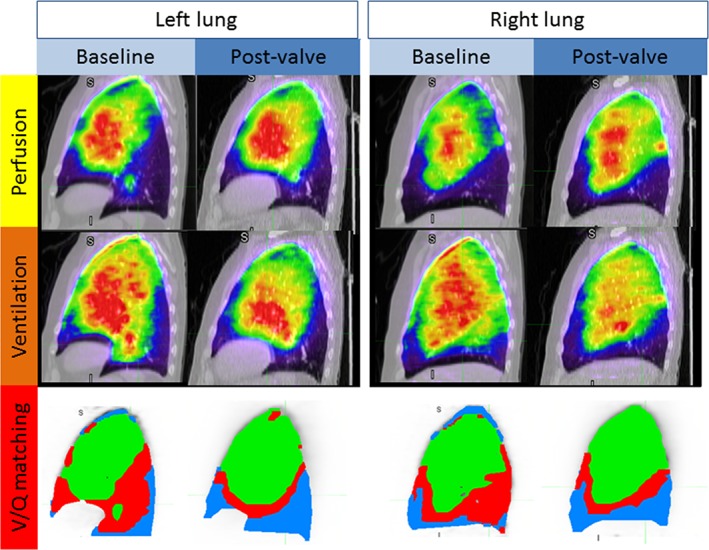
Ventilation–perfusion (V/Q) relationships at baseline and post‐endobronchial valve by Gallium‐68 (Ga‐68) V/Q photon emission tomography/computed tomography (PET/CT). Sagittal images of V/Q relationships at baseline and post‐left lower lobe endobronchial valve insertion. In the bottom third of the figure, areas of unmatched V/Q defects (red) are fewer post‐valve insertion. Areas of normal V/Q matching (green), and areas of matched V/Q defects (blue) are increased post‐valve insertion.