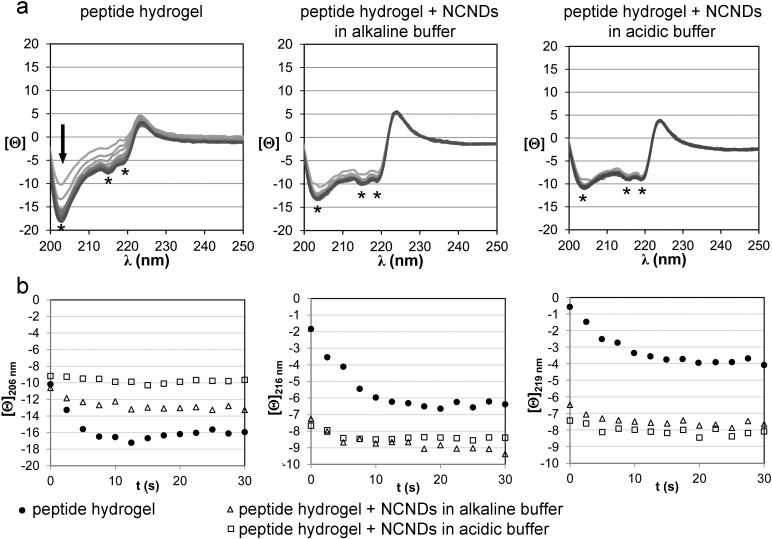
Figure 4.
a) CD spectra of self-assembled hydrogel evolution over time. The arrow indicates the direction of signal evolution. The amide signals display three minima at 206, 216 and 219 nm (denoted by *) that are displayed individually over time in b). Note: plotted [Θ] units have been divided by 1000.

