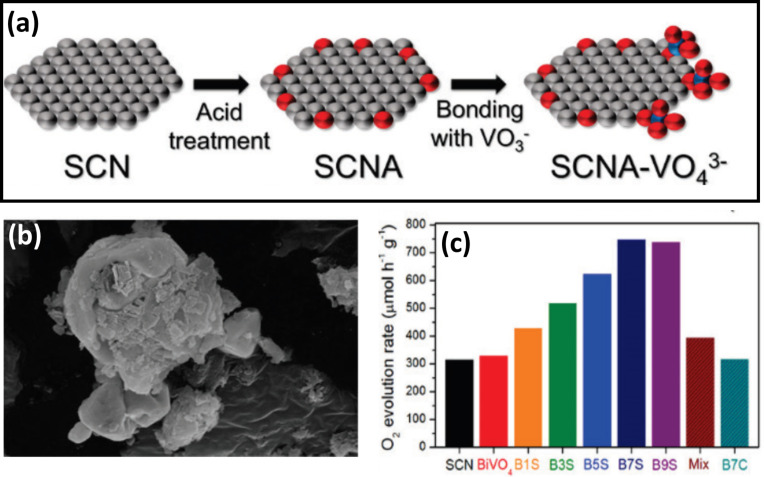
Figure 12.
(a) Schematic diagram showing the effect of SCN acid treatment that leads to the formation of a composite between SCN and BiVO4 (gray for SCN, red for oxygen, and blue for vanadium atom), (b) morphology of prepared photocatalyst, and (c) photocatalytic activity of the prepared photocatalysts. Reprinted (adapted) with permission from [84], copyright 2016 American Chemical Society.

